Catalogue No. TU1-14E-PDF
ISSN 2371-7971
Original signed by
Kathleen Fox
Chair
Transportation Safety Board of Canada
Original signed by
The Honourable Dominic LeBlanc, P.C., M.P.
President of the Queen’s Privy Council for Canada and Minister of Intergovernmental Affairs
Chair’s message
“You can’t get there if you don’t know where you’re going.”
Each year, the Transportation Safety Board of Canada (TSB) sets out a plan for where it wants to go for the coming 12 months. This is outlined in the TSB’s Departmental Plan for 2021-22, which is closely aligned with, and supports, the objectives we have identified in our new 5-year Strategic Plan (2021-22 to 2025-26).
First and foremost, the TSB will continue its work of being a world-leading investigation authority that advances transportation safety. That means we will continue to investigate selected occurrences in all four federally regulated modes (air, marine, pipeline, rail) of transportation. Our goal, as always, is to find out what happened and why—and we will report publicly on what we learn. Moreover, we will also seek to strengthen the impact of our work, notably via a continuous improvement program to ensure we standardize internal best practices and implement lessons learned. A particular emphasis will also be placed on the timeliness of investigation reports.
Furthermore, we will focus on our plan to leverage data to drive our choices and decisions. By updating the way we handle information across all our branches, we will strive to remove the outdated “silos” approach and usher in improvements in data governance, data quality and usability, and how data flows between the TSB and external stakeholders.
Just as important will be our efforts to foster a respectful, harassment-free, diversified and inclusive workplace. We will, for instance, increase efforts to recruit, retain and promote a diversified workforce; continue to provide diversity and inclusiveness training to all our employees; and identify and eliminate any barriers to diversity and inclusiveness that may exist in our workplace in a proactive manner. We will also implement a plan to operationalize our Mental Health Strategy, and track our progress.
Finally, with regard to the ongoing pandemic, we will continue to be flexible as we strive to keep employees safe, while at the same time giving them the tools they need to keep doing their job. For example, although the pandemic required a sudden and rapid shift to working remotely, much of the work behind that transformation was already well underway at the time thanks to work done as part of our current Strategic Plan focused on modernizing our operations. Thanks to the advance efforts of our hardworking IT department, we were able to make this transition almost seamlessly. Now, nearly a year later, we continue to lean into what we started, with a work environment that is more digital—and allowing our workforce to be more agile than ever.
Advancing transportation safety is a non-stop job, and since the industry is always evolving, so must we. Where possible, we’ll build on our strengths, but at the same time we’ll always remain vigilant for new ways to get things done—better and more efficiently. Canadians from coast to coast to coast can count on it.
Plans at a glance
In 2021-22, the Transportation Safety Board of Canada (TSB) is introducing its new 5-year Strategic Plan which outlines the department’s key priorities and framework for the planning horizon 2021-22 to 2025-26. The TSB’s vision of being a world-leading investigation authority that advances transportation safety is guided by six strategic objectives:
- Strengthen the impact of our investigations
- Foster an inclusive, diversified and respectful workplace
- Employ a knowledgeable and highly skilled workforce
- Leverage data to drive our choices and decisions
- Be digital by default
- Communicate with impact
These six strategic objectives are both complementary and interrelated and frame the TSB’s actions and choices in 2021-22 and onward. Specific planned activities for 2021-22 for each strategic objective can be found in the “Planning highlights” section under “Core responsibilities: planned results and resources, and key risks”.
Over the past year, the TSB has undertaken mitigating and proactive measures to anticipate and address logistical and personnel challenges in order to ensure that the department can continue its operations despite the ongoing pandemic. As a result, the TSB is well-prepared going into 2021-22 to continue fulfilling its core responsibility of independent safety investigations and communication of risks in the transportation system. At this point, the TSB does not foresee any major risks to financial or human resources.
For more information on the TSB’s plans, priorities and planned results, see the “Core responsibilities: planned results and resources, and key risks” section of this report.
Core responsibilities: planned results and resources, and key risks
This section contains detailed information on the department’s planned results and resources for each of its core responsibilities. It also contains information on key risks related to achieving those results.
Independent safety investigations and communication of risks in the transportation system
Description
The Transportation Safety Board of Canada's sole objective is to advance air, marine, rail and pipeline transportation safety. This mandate is fulfilled by conducting independent investigations into selected transportation occurrences to identify the causes and contributing factors, and the safety deficiencies evidenced by these occurrences. The Transportation Safety Board of Canada makes recommendations to reduce or eliminate any such safety deficiencies and reports publicly on its investigations. The Transportation Safety Board of Canada then follows up with stakeholders to ensure that safety actions are taken to reduce risks and improve safety.
Planning highlights
The achievement of the TSB's mandate is measured through three types of departmental result indicators. First, some performance indicators aim at reporting upon the overall safety of the transportation system. However, many variables influence transportation safety and many organizations play a role in this ultimate outcome. There is no way to directly attribute overall safety improvements to any specific organization. Accident and fatality rates are used as the best available indicators. In recent years, these indicators have generally reflected positive advancements in transportation safety and we expect similar results again in 2021-22.
The TSB's departmental results are also measured through actions taken by its stakeholders in response to its safety communications, as well as through efficiency indicators. The TSB must present compelling arguments that convince “agents of change” to take actions in response to identified safety deficiencies. The responses received, the actions taken and their timeliness are good indicators of the TSB's impact on transportation safety. The TSB actively engages with stakeholders in all modes. However, the established performance targets vary by mode to reflect the different baselines and the differing challenges from one mode to another. Currently, the greatest challenges are with the timeliness of TSB investigation reports.
Organizational priorities
The TSB Strategic Plan outlines the strategic objectives and associated priorities that have been identified by senior management to achieve its strategic outcome. This plan provides the framework that guides the identification of key activities and the TSB's investment decision making for the current exercise. During 2020-21, the TSB undertook a comprehensive analysis to prepare its next five-year Strategic Plan for the period of 2021-22 to 2025-26.
Strengthen the impact of our investigations
The TSB will continue to seek ways to improve how it conducts investigations and to provide credible, transparent and timely results that inform and influence the advancement of transportation safety in Canada and abroad. In 2021-22, the TSB will make concerted efforts to improve the timeliness of its investigation reports.
The TSB will continue initiatives aimed at making optimal use of technology to achieve the best possible outcomes with efficient, interconnected and nimble processes and systems. A more robust and user-friendly integrated safety investigation management tool will be made available to TSB investigators. A project management system will also be developed to ensure improved management of TSB resources and timely completion of laboratory projects associated with TSB investigations.
The TSB will continue its engagement in the Laboratories Canada initiative in developing a joint collaborative science facility in partnership with the National Research Council of Canada.
Foster an inclusive, diversified and respectful workplace
The TSB is committed to foster a respectful, harassment-free, diversified and inclusive workplace. In 2021-22, the TSB will work on improving its staffing processes by identifying and removing any barriers to the recruitment, retention and/or promotion of members of designated groups. The organization will aim to increase the number of employees recruited within underrepresented designated groups with the goal of achieving a workforce that reflects Canada’s diversity. The TSB will implement its revised Mental Health Strategy and monitor progress.
Employ a knowledgeable and highly skilled workforce
The TSB will focus on the recruitment, development, and retention of a high-performing and diverse workforce. In 2021-22, the TSB will ensure that employees can enhance their skills and knowledge through various external and in-house training. In particular, the TSB plans to introduce a new integrated learning management system to facilitate virtual course delivery, course registration and access to learning records. The organization will also redesign key classroom courses to make learning and knowledge transfer more effective in a virtual environment. The TSB will undertake a review of its internal policies and procedures to address how working arrangements need to evolve as a result of lessons learned during the Covid-19 pandemic.
Leverage data to drive our choices and decisions
In 2021-22, the TSB will continue the implementation of its Data Strategy to better manage data throughout its life cycle as a shared business asset. The three-phase strategy should be fully implemented by 2025-26. The TSB will also continue to explore options to support the exchange of data with external stakeholders to create efficiencies and improve the flow of data and information.
Be digital by default
The TSB plans to continue its migration to the cloud for some of its Corporate Services systems. The TSB will be using a new Government of Canada shared financial management system which will enable the organization to better plan, analyse, execute and monitor financial activities. As the organization continues to work remotely by default for most of 2021-22, it will improve network capacity to ensure employees have efficient access to workplace technology.
Communicate with impact
The TSB recognizes that strong internal communication is crucial for an engaged, well-informed workforce. In 2021-22, the TSB will continue to improve its intranet and other platforms supporting internal communication. The TSB will increase its presence across social media by developing a robust social media strategy as well as explore other options for targeted communications with stakeholders. The TSB’s Outreach Plan will also be reviewed to reflect virtual opportunities and standardize our messaging.
Experimentation
The TSB does not have any planned experimentation for 2021-22.
Key risk(s)
The TSB recognizes the need for agency-wide integrated risk management practices to effectively manage operations and to deliver on its mandate. A key element of the TSB’s risk management activities is the annual update of our Corporate Risk Profile (CRP). Six key strategic risks have been identified in our Corporate Risk Profile as representing an important threat (or opportunity) to us:
Keeping up with industry
The TSB's credibility and operational effectiveness could be impacted if it fails to keep pace with the technological changes in the transportation industry and if it does not evolve to ensure new data sources are properly exploited, optimally managed and fully analyzed.
Keeping up with workplace technology
There is a risk that TSB employees do not have access to current workplace technology tools, systems, and applications to ensure that they can deliver their work in an efficient and effective manner. There is also a need to ensure that these tools are not subject to business disruptions by third parties or other events such as natural disasters and pandemics.
Employee wellbeing
There is a need to be vigilant with respect to managing employees and their wellbeing. Due to the nature of the work performed by the TSB, employees may be exposed to significant workplace stress and emotional trauma. There is also a need to ensure that the workplace is respectful and harassment-free.
Operational readiness
There is a risk that the TSB may not be able to deploy in a timely manner, and to sustain operations, in certain remote regions due to the limited availability of transportation services and support infrastructure. There is also a risk that investigation deployment contingency plans will not be robust enough and sufficiently practiced to ensure a proper state of readiness. Furthermore, due to the small size of its workforce, the TSB may not be able to handle two major occurrences in the same mode at the same time.
Managing workload
Managing workload and expectations is a significant challenge. The TSB's workload (volume of activities) is influenced by the number, severity and complexity of transportation occurrences, and the workload cannot be predicted accurately.
Legal Challenges
Organizations and individuals are more frequently challenging the TSB business processes, as well as the application of the Canadian Transportation Accident Investigation and Safety Board (CTAISB) Act. This puts the TSB at risk that some court rulings could negatively impact the way the TSB conducts its business.
The TSB has put in place plans to mitigate these risks.
Planned results for Independent safety investigations and communication of risks in the transportation system
Notes about the Indicators
Accident rate
This indicator is measured as follows:
- For Air, the rate is the number of accidents per 100,000 hours flown in Canada (excluding ultralights and other aircraft types).
- For Marine, the rate is the number of shipping accidents involving Canadian-flag commercial vessels of 15 gross tons or more (excluding passenger vessels and fishing vessels) per million vessel-kilometres.
- For Pipeline, the rate is accidents per exajoule.
- For Rail, the rate is main-track accidents per million main-track train miles.
To determine whether the target for this indicator has been met, the accident rates for the current year are compared against the 10-year average. Where the current year result is below or is equal to the 10-year average, the target is identified as met. For Marine, the metric on vessel-kilometres is only available for 2015 to 2020. For this metric, where the current year result is below or is equal to the 6-year average, the target is identified as met.
Number of fatal accidents
This indicator is measured by comparing the number of fatal accidents for the current year against the 10-year average. Where the current year result equals the 10-year average, the target is identified as met.
Average time recommendations have been outstanding (active and dormant recommendations)
The target for this performance indicator is set annually to reflect realistic goals based upon known circumstances at the time of planning.
Percentage of responses to recommendations assessed as Fully Satisfactory
The target for this performance indicator is set annually to reflect realistic goals based on known circumstances at the time of planning.
Average time to complete a class 4 limited-scope investigation
Starting in fiscal year 2020-21, the target for this performance indicator was changed from “200 days” to “220 days” to reflect amendments to the TSB Policy on Occurrence Classification.
Program outcome indicators
The TSB currently measures its departmental results and program outcomes using the same set of indicators.
Air
| Departmental result | Departmental result indicator | Target | Date to achieve target | 2017–18 actual result |
2018–19 actual result |
2019–20 actual result |
|---|---|---|---|---|---|---|
Transportation system is safer |
Accident rate (over 10-year period) |
Continue downward trend in accident rate |
March 2022 |
Met There has been a significant downward trend in the accident rate for Canadian-registered aircraft over the past 10 years. The aviation accident rate in 2017 was 4.3 accidents per 100,000 hours flown, below the 10-year average of 4.8. |
Met There has been a significant downward trend in the accident rate for Canadian-registered aircraft over the past 10 years. The aviation accident rate in 2018 was 3.5 accidents per 100,000 hours flown, below the 10-year average of 5.2. |
Met There has been a significant downward trend in the accident rate for Canadian-registered aircraft over the past 10 years. The aviation accident rate in 2019 was 3.7 accidents per 100,000 hours flown, below the 10-year average of 4.9. |
Transportation system is safer |
Number of fatal accidents (over 10-year period) |
Reduction in number of fatal accidents |
March 2022 |
Met The number of fatal accidents was 21, below the 10-year average of 33 and fatalities in 2017 totalled 32, lower than the 10-year average of 57. |
Met The number of fatal accidents was 23, below the 10-year average of 32 and fatalities in 2018 totalled 38, lower than the 10-year average of 55. |
Not met The number of fatal accidents was 33, higher than the 10-year average of 30 and fatalities in 2019 totalled 70, higher than the 10-year average of 52. |
The regulators and the transportation industry respond to identified safety deficiencies |
Percentage of responses to recommendations assessed as Fully Satisfactory |
77% |
March 2022 |
Met 73% |
Met 75% |
Met 77% |
The regulators and the transportation industry respond to identified safety deficiencies |
Percentage of safety advisories on which safety actions have been taken |
75% |
March 2022 |
Met 100% |
Met 75% |
Met 100% |
The regulators and the transportation industry respond to identified safety deficiencies |
Average time recommendations have been outstanding (active and dormant recommendations) |
15 years |
March 2022 |
Not met 12.4 years |
Met 11 years |
Met 10.5 years |
Occurrence investigations are efficient |
Average time to complete a class 1 safety issue investigation |
730 days |
March 2022 |
Not applicable |
Met 689 days |
Not met 1696 days |
Occurrence investigations are efficient |
Average time to complete a class 2 complex investigation |
600 days |
March 2022 |
Not applicable |
Met 550 days |
Not met 686 days |
Occurrence investigations are efficient |
Average time to complete a class 3 detailed investigation |
450 days |
March 2022 |
Not applicable |
Met 447 days |
Met 428 days |
Occurrence investigations are efficient |
Average time to complete a class 4 limited-scope investigation |
220 days |
March 2022 |
Not applicable |
Met 192 days |
Not met 212 days |
Occurrence investigations are efficient |
Average time to complete a class 5 data-gathering investigation |
60 days |
March 2022 |
Not applicable |
Met 14 days |
Met 39 days |
Marine
| Departmental result | Departmental result indicator | Target | Date to achieve target | 2017–18 actual result |
2018–19 actual result |
2019–20 actual result |
|---|---|---|---|---|---|---|
Transportation system is safer |
Accident rate (over 10-year period) |
Continue downward trend in accident rate |
March 2022 |
Met The 2017 accident rates for Canadian flag commercial vessels, for foreign commercial non-fishing vessels, and for fishing vessels were lower than the 10-year averages. The marine accident rates in 2017 were: 2.5 accidents per 1,000 vessel movements for Canadian flag commercial vessels, below the 10-year average of 3.1. 1.3 accidents per 1,000 vessel movements for foreign commercial non-fishing vessels, below the 10-year average of 1.5. 5.8 accidents per 1,000 active fishing vessels, below the 10-year average of 6.7. |
Met The 2018 accident rates for Canadian flag commercial vessels, for foreign commercial non-fishing vessels, and for fishing vessels were lower than the 10-year averages. The marine accident rates in 2018 were: 2.0 accidents per 1,000 vessel movements for Canadian flag commercial vessels, below the 10-year average of 2.8. 1.0 accident per 1,000 vessel movements for foreign commercial non-fishing vessels, below the 10-year average of 1.5. 5.1 accidents per 1,000 active fishing vessels, below the 10-year average of 6.3. |
Not met The 2019 accident rate for Canadian flag commercial vessels was lower than the 4-year average, and for fishing vessels was lower than the 10-year average. However, the foreign commercial non-fishing vessels was higher than the 4-year average. The marine accident rates in 2019 were: 4.9 accidents per million vessel-kilometres for Canadian flag commercial vessels, below the 4-year average of 6.3. 2.0 accident per million vessel-kilometres for foreign commercial non-fishing vessels, above the 4-year average of 1.6. 5.0 accidents per 1,000 active fishing vessels, below the 10-year average of 6.2. |
Transportation system is safer |
Number of fatal accidents (over 10-year period) |
Reduction in number of fatal accidents |
March 2022 |
Not met The number of fatal accidents was 10, below the 10-year average of 12.4 and the number of fatalities in 2017 totalled 11, lower than the 10-year average of 16.4. |
Not met The number of fatal accidents was 14, above the 10-year average of 11.9 and the number of fatalities in 2018 totalled 22, above the 10-year average of 16.0. |
Not met The number of fatal accidents was 13, above the 10-year average of 11.3 and the number of fatalities in 2019 totalled 17, above the 10-year average of 15.2. |
The regulators and the transportation industry respond to identified safety deficiencies |
Percentage of responses to recommendations assessed as Fully Satisfactory |
85% |
March 2022 |
Met 86% |
Not met 83% |
Met 85% |
The regulators and the transportation industry respond to identified safety deficiencies |
Percentage of safety advisories on which safety actions have been taken |
60% |
March 2022 |
Not met 0% |
Met 60% |
Not met 33% |
The regulators and the transportation industry respond to identified safety deficiencies |
Average time recommendations have been outstanding (active and dormant recommendations) |
10 years |
March 2022 |
Not met 10.9 years |
Met 10.6 years |
Not met 10.6 years |
Occurrence investigations are efficient |
Average time to complete a class 1 safety issue investigation |
730 days |
March 2022 |
Not applicable |
Not applicable |
Not applicable |
Occurrence investigations are efficient |
Average time to complete a class 2 complex investigation |
600 days |
March 2022 |
Not applicable |
Met 574 days |
Not applicable |
Occurrence investigations are efficient |
Average time to complete a class 3 detailed investigation |
450 days |
March 2022 |
Not applicable |
Met 417 days |
Not met 548 days |
Occurrence investigations are efficient |
Average time to complete a class 4 limited-scope investigation |
220 days |
March 2022 |
Not applicable |
Not met 294 days |
Not met 341 days |
Occurrence investigations are efficient |
Average time to complete a class 5 data-gathering investigation |
60 days |
March 2022 |
Not applicable |
Met 52 days |
Met 30 days |
Pipeline
| Departmental result | Departmental result indicator | Target | Date to achieve target | 2017–18 actual result |
2018–19 actual result |
2019–20 actual result |
|---|---|---|---|---|---|---|
Transportation system is safer |
Accident rate (over 10-year period) |
Continue downward trend in accident rate |
March 2022 |
Met The 2017 rate was 0.3 pipeline accidents per exajoule, below the 10-year average of 0.5. |
Met The 2018 rate was 0.06 pipeline accidents per exajoule, below the 10-year average of 0.3. |
Met The 2019 rate was 0.0 pipeline accidents per exajoule, below the 10-year average of 0.4. |
The regulators and the transportation industry respond to identified safety deficiencies |
Percentage of responses to recommendations assessed as Fully Satisfactory |
100% |
March 2022 |
Met 100% |
Met 100% |
Met 100% |
The regulators and the transportation industry respond to identified safety deficiencies |
Percentage of safety advisories on which safety actions have been taken |
75% |
March 2022 |
Not applicable |
Not applicable |
Met 100% |
The regulators and the transportation industry respond to identified safety deficiencies |
Average time recommendations have been outstanding (active and dormant recommendations) |
7 years |
March 2022 |
Not applicable |
Not applicable |
Not applicable |
Occurrence investigations are efficient |
Average time to complete a class 1 safety issue investigation |
730 days |
March 2022 |
Not applicable |
Not applicable |
Not applicable |
Occurrence investigations are efficient |
Average time to complete a class 2 complex investigation |
600 days |
March 2022 |
Not applicable |
Not applicable |
Not applicable |
Occurrence investigations are efficient |
Average time to complete a class 3 detailed investigation |
450 days |
March 2022 |
Not applicable |
Not met 522 days |
Not met 513 days |
Occurrence investigations are efficient |
Average time to complete a class 4 limited-scope investigation |
220 days |
March 2022 |
Not applicable |
Not met 264 days |
Not applicable |
Occurrence investigations are efficient |
Average time to complete a class 5 data-gathering investigation |
60 days |
March 2022 |
Not applicable |
Not met 165 days |
Not met 62 days |
Rail
| Departmental result | Departmental result indicator | Target | Date to achieve target | 2017–18 actual result | 2018–19 actual result | 2019–20 actual result |
|---|---|---|---|---|---|---|
Transportation system is safer |
Accident rate (over 10-year period) |
Continue downward trend in accident rate |
March 2022 |
Not met The main-track accident rate in 2017 was 2.6 accidents per million main-track train miles, above the 10-year average of 2.4. |
Not met The main-track accident rate in 2018 was 2.6 accidents per million main-track train miles, above the 10-year average of 2.3. |
Not met The main-track accident rate in 2019 was 3.3 accidents per million main-track train miles, above the 10-year average of 2.3. |
Transportation system is safer |
Number of fatal accidents (over 10-year period) |
Reduction in number of fatal accidents |
March 2022 |
Met The number of fatal accidents in 2017 was 75, above the 10-year average of 67. Rail fatalities totalled 77 in 2017, above the 10-year average of 76. |
Met The number of fatal accidents in 2018 was 55, below the 10-year average of 66. Rail fatalities totalled 57 in 2018, below the 10-year average of 74. |
Not met The number of fatal accidents in 2019 was 68, above the 10-year average of 64.6. Rail fatalities totalled 72 in 2019, below the 10-year average of 72.8. |
The regulators and the transportation industry respond to identified safety deficiencies |
Percentage of responses to recommendations assessed as Fully Satisfactory |
88% |
March 2022 |
Not met 88% |
Met 88% |
Met 90% |
The regulators and the transportation industry respond to identified safety deficiencies |
Percentage of safety advisories on which safety actions have been taken |
60% |
March 2022 |
Not met 29% |
Not met 11% |
Not met 11% |
The regulators and the transportation industry respond to identified safety deficiencies |
Average time recommendations have been outstanding (active and dormant recommendations) |
7 years |
March 2022 |
Met 6.5 years |
Not met 7.8 years |
Not met 9.2 years |
Occurrence investigations are efficient |
Average time to complete a class 1 safety issue investigation |
730 days |
March 2022 |
Not applicable |
Not applicable |
Not applicable |
Occurrence investigations are efficient |
Average time to complete a class 2 complex investigation |
600 days |
March 2022 |
Not applicable |
Not met 672 days |
Not applicable |
Occurrence investigations are efficient |
Average time to complete a class 3 detailed investigation |
450 days |
March 2022 |
Not applicable |
Met 447 days |
Not met 520 days |
Occurrence investigations are efficient |
Average time to complete a class 4 limited-scope investigation |
220 days |
March 2022 |
Not applicable |
Not met 214 days |
Not met 219 days |
Occurrence investigations are efficient |
Average time to complete a class 5 data-gathering investigation |
60 days |
March 2022 |
Not applicable |
Met 51 days |
Not met 105 days |
Financial, human resources and performance information for the TSB’s program inventory is available in the GC InfoBase.
| 2021–22 budgetary spending (as indicated in Main Estimates) |
2021–22 planned spending | 2022–23 planned spending | 2023–24 planned spending |
|---|---|---|---|
27,936,216 |
27,936,216 |
28,006,661 |
28,006,661 |
Financial, human resources and performance information for the TSB’s program inventory is available in the GC InfoBase.
| 2021–22 planned full-time equivalents | 2022–23 planned full-time equivalents | 2023–24 planned full-time equivalents |
|---|---|---|
177 |
177 |
177 |
Financial, human resources and performance information for the TSB’s program inventory is available in the GC InfoBase.
Internal Services: planned results
Description
Internal Services are those groups of related activities and resources that the federal government considers to be services in support of Programs and/or required to meet corporate obligations of an organization. Internal Services refers to the activities and resources of the 10 distinct services that support Program delivery in the organization, regardless of the Internal Services delivery model in a department. These services are:
- Management and Oversight Services
- Communications Services
- Legal Services
- Human Resources Management Services
- Financial Management Services
- Information Management Services
- Information Technology Services
- Real Property Management Services
- Materiel Management Services
- Acquisition Management Services
Planning highlights
The Internal Services program will continue to ensure that the TSB makes full and effective use of available tools and systems and that we are working in a digital-first environment.
We will also improve our network capacity and continue our migration to the Cloud to ensure employees have efficient access to workplace technology, whether they are working in our facilities or remotely.
We will maintain our logistical support to the department and its employees in response to COVID-19 and will ensure an eventual return to the workplace focused on the well-being and health of our employees.
Additionally, Internal Services personnel will support initiatives that affect employee wellbeing such as: the implementation of our mental health strategy, the OHS program, as well as on-going efforts to create a respectful and diverse workplace.
Other priorities include supporting the implementation of our Data Strategy Plan as well as the modernization of our office and Lab facilities and equipment to provide our employees with a renewed and highly functional work environment that promotes efficiency, scientific collaboration and innovation.
| 2021–22 budgetary spending (as indicated in Main Estimates) |
2021–22 planned spending |
2022–23 planned spending |
2023–24 planned spending |
|---|---|---|---|
6,984,054 |
6,984,054 |
7,001,665 |
7,001,665 |
| 2021–22 planned full-time equivalents | 2022–23 planned full-time equivalents | 2023–24 planned full-time equivalents |
|---|---|---|
50 |
50 |
50 |
Spending and human resources
This section provides an overview of the department’s planned spending and human resources for the next three consecutive fiscal years and compares planned spending for the upcoming year with the current and previous years’ actual spending.
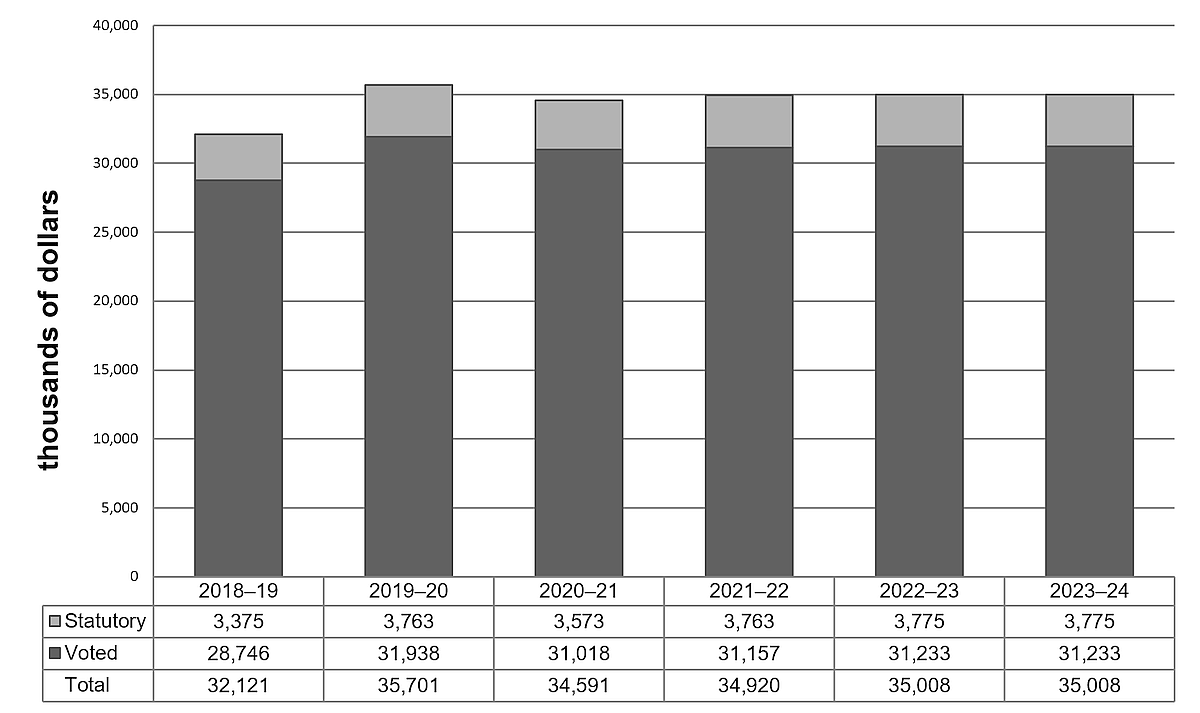
Planned spending
Departmental spending 2018–19 to 2023–24
The following graph presents planned (voted and statutory) spending over time.
Budgetary planning summary for core responsibilities and Internal Services (dollars)
The following table shows actual, forecast and planned spending for each of the TSB’s core responsibilities and to Internal Services for the years relevant to the current planning year.
| Core responsibilities and Internal Services | 2018–19 expenditures | 2019–20 expenditures | 2020–21 forecast spending | 2021–22 budgetary spending (as indicated in Main Estimates) | 2021–22 planned spending | 2022–23 planned spending | 2023–24 planned spending |
|---|---|---|---|---|---|---|---|
Independent safety investigations and communication of risks in the transportation system |
25,337,317 |
28,806,211 |
27,672,844 |
27,936,216 |
27,936,216 |
28,006,661 |
28,006,661 |
Internal Services |
6,783,585 |
6,894,275 |
6,918,211 |
6,984,054 |
6,984,054 |
7,001,665 |
7,001,665 |
Total |
32,120,902 |
35,700,486 |
34,591,055 |
34,920,270 |
34,920,270 |
35,008,326 |
35,008,326 |
The 2018-19 and 2019-20 expenditures presented are actual results as published in the Public Accounts of Canada. The significant increase in actual spending in 2019-20 when compared to prior years is mainly due to higher salary expenditures in the form of retroactive payments for previous years as well as in-year wage increases. These increases are in accordance with signed and ratified collective agreements. In 2019-20, the TSB also progressed in its staffing of vacant positions and had higher expenditures for contracts related to legal services and digital transformation projects.
Forecast spending for 2020-21 and onward planned spending is anticipated to remain relatively consistent with only planned funding increases due to collective agreement wage increases.
It is important to note that in accordance with the definition of planned spending, amounts for 2021-22 and ongoing fiscal years consist of Main Estimates and Annual Reference Level amounts only. Forecast spending for 2020-21 is based on known forecasts at the time of report preparation.
Planned human resources
The following table shows actual, forecast and planned full-time equivalents (FTEs) for each core responsibility in the TSB’s departmental results framework and to Internal Services for the years relevant to the current planning year.
| Core responsibilities and Internal Services | 2018–19 actual full‑time equivalents | 2019–20 actual full‑time equivalents | 2020–21 forecast full‑time equivalents | 2021–22 planned full‑time equivalents | 2022–23 planned full‑time equivalents | 2023–24 planned full‑time equivalents |
|---|---|---|---|---|---|---|
Independent safety investigations and communication of risks in the transportation system |
163 |
173 |
177 |
177 |
177 |
177 |
Internal Services |
46 |
47 |
50 |
50 |
50 |
50 |
Total |
209 |
220 |
227 |
227 |
227 |
227 |
Actual full-time equivalents (FTEs) for 2018-19 were less than anticipated due to vacant positions. In 2019-20, the TSB was able to staff many of those vacancies, bringing its FTE count to 220, which was only slightly under the 2019-20 planned figures. Effective 2020-21, the TSB established a new revised forecast of 227 FTEs. The increase is due to the TSB’s plan to continue filling vacancies rapidly as well as some internal reorganizations.
Estimates by vote
Information on the TSB’s organizational appropriations is available in the 2021–22 Main Estimates.
Future-oriented Condensed statement of operations
The future‑oriented condensed statement of operations provides an overview of the TSB’s operations for 2020–21 to 2021–22.
The amounts for forecast and planned results in this statement of operations were prepared on an accrual basis. The amounts for forecast and planned spending presented in other sections of the Departmental Plan were prepared on an expenditure basis. Amounts may therefore differ.
A more detailed future‑oriented statement of operations and associated notes, including a reconciliation of the net cost of operations to the requested authorities, are available on the TSB website.
| Financial information | 2020–21 forecast results | 2021–22 planned results | Difference (2021–22 planned results minus 2020–21 forecast results) |
|---|---|---|---|
Total expenses |
39,204 |
39,951 |
+2% |
Total revenues |
37 |
35 |
-5% |
Net cost of operations before government funding and transfers |
39,167 |
39,916 |
+2% |
The TSB’s 2020-21 forecast and 2021-22 planned results are expected to remain consistent. The slight difference in expenses is due mainly to collective agreement increases for personnel salaries.
Corporate information
Organizational profile
Appropriate minister(s): The Honourable Dominic LeBlanc
Institutional head: Kathleen Fox
Ministerial portfolio: Privy Council
Enabling instrument(s):Canadian Transportation Accident Investigation and Safety Board Act,S.C. 1989, c. 3
Year of incorporation / commencement: 1990
Raison d’être, mandate and role: who we are and what we do
“Raison d’être, mandate and role: who we are and what we do” is available on the TSB's website.
Operating context
Information on the operating context is available on the TSB's website.
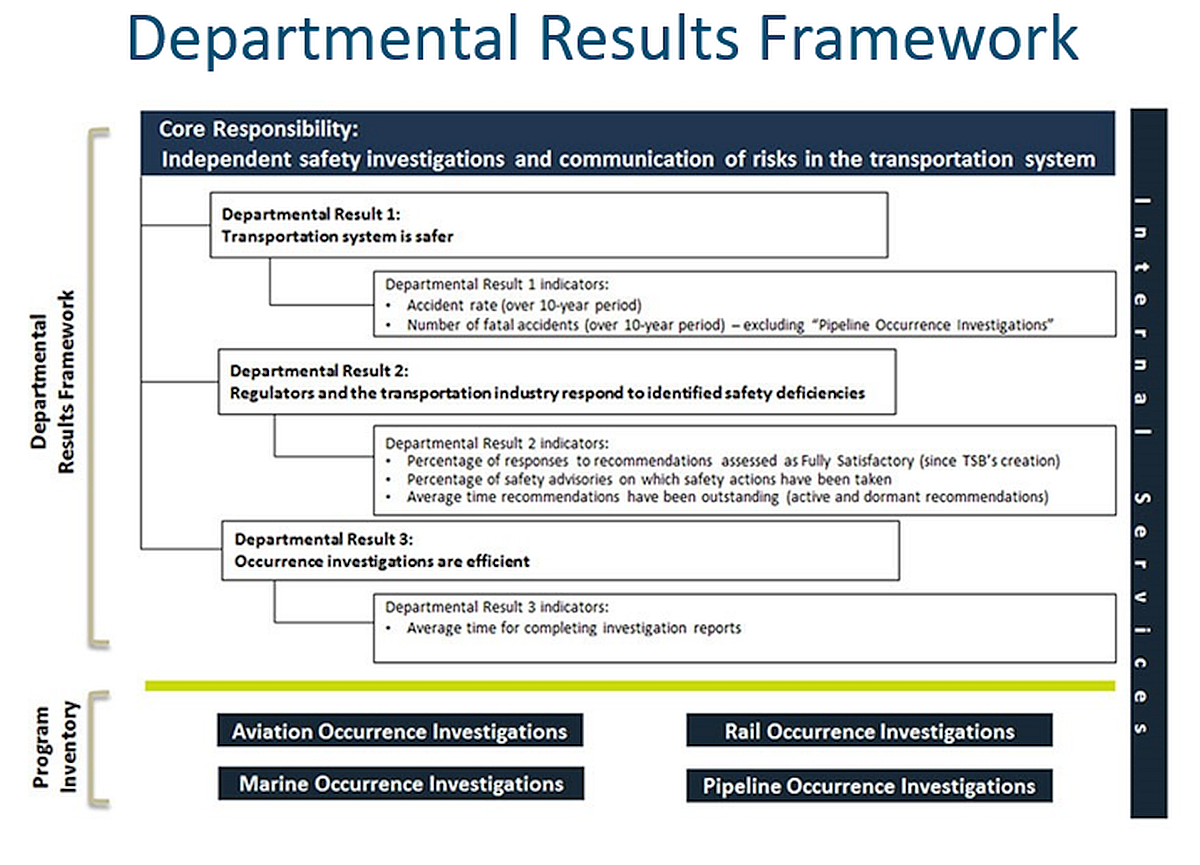
Reporting framework
The TSB approved departmental results framework and program inventory for 2020–21 are as follows.
Supporting information on the program inventory
Supporting information on planned expenditures, human resources, and results related to the TSB’s program inventory is available in the GC InfoBase.
Supplementary information tables
The following supplementary information tables are available on the TSB’s website.
Federal tax expenditures
The TSB’s Departmental Plan does not include information on tax expenditures that relate to its planned results for 2021–22.
Tax expenditures are the responsibility of the Minister of Finance, and the Department of Finance Canada publishes cost estimates and projections for government‑wide tax expenditures each year in the Report on Federal Tax Expenditures. This report provides detailed information on tax expenditures, including objectives, historical background and references to related federal spending programs, as well as evaluations, research papers and gender-based analysis. The tax measures presented in this report are solely the responsibility of the Minister of Finance.
Organizational contact information
Mailing address
Transportation Safety Board of Canada
Place du Centre
200 Promenade du Portage, 4th Floor
Gatineau, Quebec K1A 1K8
Telephone: 1-800-387-3557
Email: communications@bst-tsb.gc.ca
Website: http://www.bst-tsb.gc.ca
Appendix: definitions
- appropriation (crédit)
- Any authority of Parliament to pay money out of the Consolidated Revenue Fund.
- budgetary expenditures (dépenses budgétaires)
- Operating and capital expenditures; transfer payments to other levels of government, organizations or individuals; and payments to Crown corporations.
- core responsibility (responsabilité essentielle)
- An enduring function or role performed by a department. The intentions of the department with respect to a core responsibility are reflected in one or more related departmental results that the department seeks to contribute to or influence.
- Departmental Plan (plan ministériel)
- A report on the plans and expected performance of a department over a 3‑year period. Departmental Plans are tabled in Parliament each spring.
- departmental priority (priorité ministérielle)
- A plan or project that a department has chosen to focus and report on during the planning period. Departmental priorities represent the things that are most important or what must be done first to support the achievement of the desired departmental results.
- departmental result (résultat ministériel)
- A consequence or outcome that a department seeks to achieve. A departmental result is often outside departments’ immediate control, but it should be influenced by program-level outcomes.
- departmental result indicator (indicateur de résultat ministériel)
- A factor or variable that provides a valid and reliable means to measure or describe progress on a departmental result.
- departmental results framework (cadre ministériel des résultats)
- A framework that consists of the department’s core responsibilities, departmental results and departmental result indicators.
- Departmental Results Report (rapport sur les résultats ministériels)
- A report on a department’s actual accomplishments against the plans, priorities and expected results set out in the corresponding Departmental Plan.
- experimentation (expérimentation)
- The conducting of activities that seek to first explore, then test and compare, the effects and impacts of policies and interventions in order to inform evidence-based decision-making, and improve outcomes for Canadians, by learning what works and what doesn’t. Experimentation is related to, but distinct form innovation (the trying of new things), because it involves a rigorous comparison of results. For example, using a new website to communicate with Canadians can be an innovation; systematically testing the new website against existing outreach tools or an old website to see which one leads to more engagement, is experimentation.
- full‑time equivalent (équivalent temps plein)
- A measure of the extent to which an employee represents a full person‑year charge against a departmental budget. Full‑time equivalents are calculated as a ratio of assigned hours of work to scheduled hours of work. Scheduled hours of work are set out in collective agreements.
- gender-based analysis plus (GBA+) (analyse comparative entre les sexes plus [ACS+])
- An analytical process used to assess how diverse groups of women, men and gender-diverse people experience policies, programs and services based on multiple factors including race, ethnicity, religion, age, and mental or physical disability.
- government-wide priorities (priorités pangouvernementales)
- For the purpose of the 2020–21 Departmental Plan, government-wide priorities refers to those high-level themes outlining the government’s agenda in the 2015 Speech from the Throne, namely: Growth for the Middle Class; Open and Transparent Government; A Clean Environment and a Strong Economy; Diversity is Canada's Strength; and Security and Opportunity.
- horizontal initiative (initiative horizontale)
- An initiative in which two or more federal organizations are given funding to pursue a shared outcome, often linked to a government priority.
- non‑budgetary expenditures (dépenses non budgétaires)
- Net outlays and receipts related to loans, investments and advances, which change the composition of the financial assets of the Government of Canada.
- performance (rendement)
- What an organization did with its resources to achieve its results, how well those results compare to what the organization intended to achieve, and how well lessons learned have been identified.
- performance indicator (indicateur de rendement)
- A qualitative or quantitative means of measuring an output or outcome, with the intention of gauging the performance of an organization, program, policy or initiative respecting expected results.
- performance reporting (production de rapports sur le rendement)
- The process of communicating evidence‑based performance information. Performance reporting supports decision-making, accountability and transparency.
- plan (plan)
- The articulation of strategic choices, which provides information on how an organization intends to achieve its priorities and associated results. Generally a plan will explain the logic behind the strategies chosen and tend to focus on actions that lead up to the expected result.
- planned spending (dépenses prévues)
-
For Departmental Plans and Departmental Results Reports, planned spending refers to those amounts presented in the Main Estimates.
A department is expected to be aware of the authorities that it has sought and received. The determination of planned spending is a departmental responsibility, and departments must be able to defend the expenditure and accrual numbers presented in their Departmental Plans and Departmental Results Reports.
- program (programme)
- Individual or groups of services, activities or combinations thereof that are managed together within the department and focus on a specific set of outputs, outcomes or service levels.
- program inventory (répertoire des programmes)
- Identifies all of the department’s programs and describes how resources are organized to contribute to the department’s core responsibilities and results.
- result (résultat)
- An external consequence attributed, in part, to an organization, policy, program or initiative. Results are not within the control of a single organization, policy, program or initiative; instead they are within the area of the organization’s influence.
- statutory expenditures (dépenses législatives)
- Expenditures that Parliament has approved through legislation other than appropriation acts. The legislation sets out the purpose of the expenditures and the terms and conditions under which they may be made.
- strategic outcome (résultat stratégique)
- A long-term and enduring benefit to Canadians that is linked to the organization’s mandate, vision and core functions.
- target (cible)
- A measurable performance or success level that an organization, program or initiative plans to achieve within a specified time period. Targets can be either quantitative or qualitative.
- voted expenditures (dépenses votées)
- Expenditures that Parliament approves annually through an Appropriation Act. The vote wording becomes the governing conditions under which these expenditures may be made.