The Transportation Safety Board of Canada (TSB) gathers and uses transportation occurrence data during the course of its investigations to analyze safety deficiencies and identify risks in the Canadian air transportation system.
It should be noted that certain characteristics of the data constrain statistical analysis and identification of emerging trends. These include the small totals of accidents and incidents, the large variability in the data from year to year, and changes to regulations and definitions. The reader is cautioned to keep these limitations in mind when reading this summary to avoid drawing conclusions that cannot be supported by statistical analysis.
Throughout this document, there are instances where categories of occurrences sum to more than the total number of occurrences. For example, if a single occurrence involves an airplaneFootnote 1 and a glider, the occurrence count will increase by one in each aircraft category but the occurrence itself will be counted only once in the total of occurrences.
The 2021 data were collected according to the reporting requirements described in the Transportation Safety Board Regulations in force during that calendar year.
The statistics presented here reflect the TSB Aviation Safety Information System (ASIS) database at 15 March 2022. Since the occurrence data are constantly being updated in the live database, the statistics may change slightly over time.
Also, as many occurrences are limited to data gathering, information recorded on some occurrences may not have been verified.
COVID-19 impacts on civil aviation in Canada
Air transportation in Canada continued to be affected by COVID-19 during the whole of 2021. As the year progressed, vaccination rates increased and travel restrictions were eased in Canada and abroad, and commercial air travel resumed—in particular during the second half of the year. Information collected by Statistics Canada indicates that total aircraft movements (take-offs and landings) at the 90 airports with NAV CANADA towers and flight service stations numbered just under 300 000 in December 2021, up almost 17% from December 2020. Itinerant movements (from one airport to another) rose almost 35% to 215 000, while local movements (within the vicinity of the airport) declined nearly 14% to 83 000. Compared with December 2019, before the pandemic, total movements were down 19.7% in December 2021. Itinerant movements fell 21.0%, while local movements declined 16.3% (Figure 1). Unfortunately, data for small airports (without NAV CANADA towers or flight service stations) are not available.
Overall, aircraft movements at the 90 airports serviced by NAV CANADA reached 4.29 million in 2021, up 11.8% from 3.84 million in 2020. Compared with 2019 (before the pandemic), total aircraft movements in 2021 were down 26.8%. This figure is indicative of a partial recovery of activity in the commercial sectors responsible for air travel, air cargo, aerial work, and flight training. The numbers presented above also include recreational aviation activity at major airports. However, it is difficult to estimate the amount of activity – commercial or private – at small airports in Canada, or off-airport entirely, and therefore a full picture of aviation industry activity is lacking. Nonetheless, these activity patterns are informative, and give partial context to the accident statistics discussed in this document.
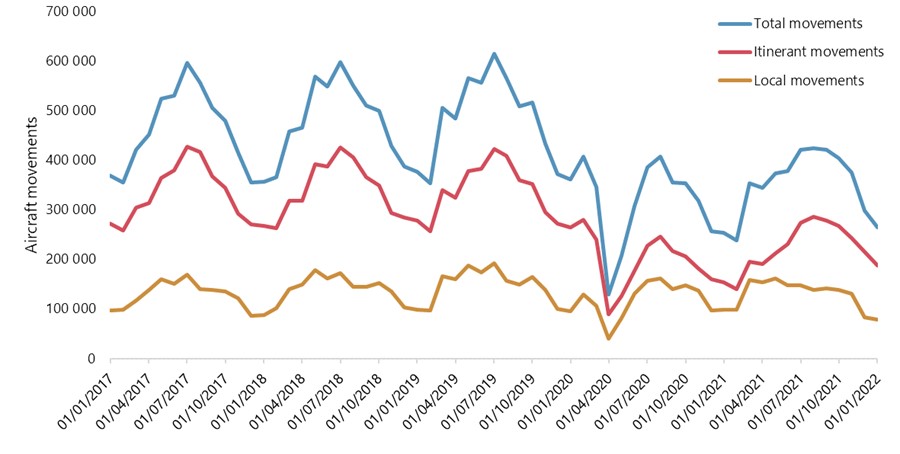
Figure 1. Data table
| Total movements | Itinerant movements | Local movements | |
|---|---|---|---|
| 1/1/2017 | 368525 | 272342 | 96183 |
| 2/1/2017 | 355609 | 257757 | 97852 |
| 3/1/2017 | 421525 | 304040 | 117485 |
| 4/1/2017 | 452788 | 313838 | 138950 |
| 5/1/2017 | 524165 | 364618 | 159547 |
| 6/1/2017 | 530185 | 380257 | 149928 |
| 7/1/2017 | 596387 | 427137 | 169250 |
| 8/1/2017 | 556485 | 416408 | 140077 |
| 9/1/2017 | 506031 | 367222 | 138809 |
| 10/1/2017 | 479630 | 343841 | 135789 |
| 11/1/2017 | 414525 | 292711 | 121814 |
| 12/1/2017 | 355899 | 270239 | 85660 |
| 1/1/2018 | 356097 | 268128 | 87969 |
| 2/1/2018 | 365673 | 263590 | 102083 |
| 3/1/2018 | 458844 | 318899 | 139945 |
| 4/1/2018 | 466365 | 317660 | 148705 |
| 5/1/2018 | 569532 | 391738 | 177794 |
| 6/1/2018 | 549294 | 388050 | 161244 |
| 7/1/2018 | 598447 | 426450 | 171997 |
| 8/1/2018 | 550178 | 405178 | 145000 |
| 9/1/2018 | 510191 | 365853 | 144338 |
| 10/1/2018 | 500413 | 348574 | 151839 |
| 11/1/2018 | 429143 | 293884 | 135259 |
| 12/1/2018 | 387152 | 284020 | 103132 |
| 1/1/2019 | 376562 | 278669 | 97893 |
| 2/1/2019 | 353084 | 256199 | 96885 |
| 3/1/2019 | 506391 | 340046 | 166345 |
| 4/1/2019 | 484941 | 324284 | 160657 |
| 5/1/2019 | 565293 | 378085 | 187208 |
| 6/1/2019 | 556418 | 383031 | 173387 |
| 7/1/2019 | 614443 | 422860 | 191583 |
| 8/1/2019 | 566328 | 409000 | 157328 |
| 9/1/2019 | 509445 | 360013 | 149432 |
| 10/1/2019 | 517071 | 352808 | 164263 |
| 11/1/2019 | 433748 | 294805 | 138943 |
| 12/1/2019 | 371562 | 272185 | 99377 |
| 1/1/2020 | 360810 | 265011 | 95799 |
| 2/1/2020 | 407957 | 279154 | 128803 |
| 3/1/2020 | 346138 | 240250 | 105888 |
| 4/1/2020 | 128849 | 89354 | 39495 |
| 5/1/2020 | 207555 | 126650 | 80905 |
| 6/1/2020 | 308141 | 177291 | 130850 |
| 7/1/2020 | 385286 | 228068 | 157218 |
| 8/1/2020 | 406796 | 245591 | 161205 |
| 9/1/2020 | 355919 | 216711 | 139208 |
| 10/1/2020 | 353546 | 206417 | 147129 |
| 11/1/2020 | 318388 | 181428 | 136960 |
| 12/1/2020 | 256064 | 159635 | 96429 |
| 1/1/2021 | 253189 | 154179 | 99010 |
| 2/1/2021 | 238968 | 140341 | 98627 |
| 3/1/2021 | 354055 | 195070 | 158985 |
| 4/1/2021 | 344475 | 191006 | 153469 |
| 5/1/2021 | 373761 | 212212 | 161549 |
| 6/1/2021 | 378544 | 230376 | 148168 |
| 7/1/2021 | 421287 | 274197 | 147090 |
| 8/1/2021 | 424268 | 286164 | 138104 |
| 9/1/2021 | 420637 | 279051 | 141586 |
| 10/1/2021 | 405028 | 267048 | 137980 |
| 11/1/2021 | 374394 | 243597 | 130797 |
| 12/1/2021 | 298233 | 215081 | 83152 |
| 1/1/2022 | 264879 | 187039 | 77840 |
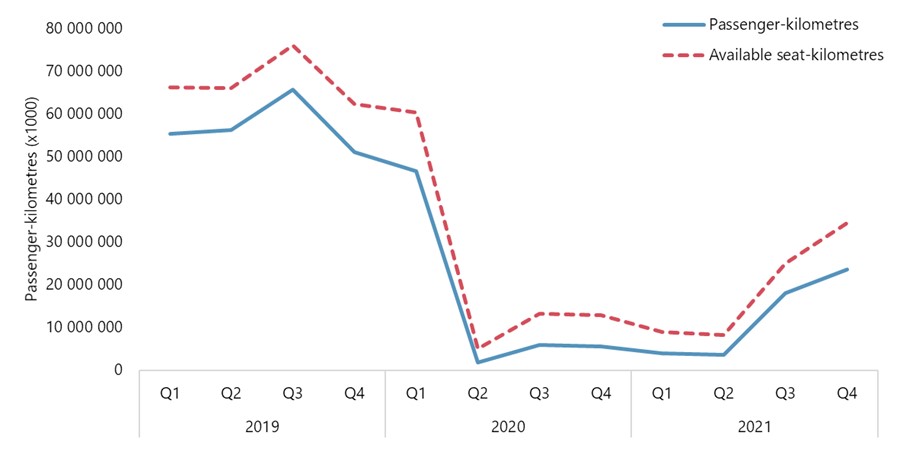
Figure 2. Data table
| Year | Quarter | Passenger-kilometres | Available seat-kilometres |
|---|---|---|---|
| 2019 | Q1 | 55,341,561 | 66,338,547 |
| Q2 | 56,200,066 | 66,081,488 | |
| Q3 | 65,756,640 | 76,026,141 | |
| Q4 | 51,021,123 | 62,322,435 | |
| 2020 | Q1 | 46,666,237 | 60,289,994 |
| Q2 | 1,782,187 | 4,952,357 | |
| Q3 | 5,909,416 | 13,148,174 | |
| Q4 | 5,509,113 | 12,925,746 | |
| 2021 | Q1 | 3,859,056 | 8,855,045 |
| Q2 | 3,587,148 | 8,212,215 | |
| Q3 | 18,037,521 | 25,091,135 | |
| Q4 | 23,507,970 | 34,506,448 |
Overview of accidents and fatalities
Accident counts
Air transportation occurrences are reportable to the TSB if they occur in Canada. Occurrences that take place outside of Canada are also reportable if they involve Canadian-registered aircraft, and meet the criteria laid out in the TSB Regulations.Footnote 4
In 2021, a total of 190 air transportation accidents were reported to the TSB (Table 1 and Figure 3). This number is 12% higher than the previous year’s total of 170 accidents but 21% below the yearly average of 239 accidents reported in the prior 10 years, 2011 to 2020. Most (183) of the accidents in 2021 took place in Canada and involved Canadian-registered aircraft. Six accidents involving Canadian-registered aircraft took place outside Canada, and one accident in Canada involved a foreign-registered aircraft. In general, the number of air transportation accidents has been decreasing in the last decade.
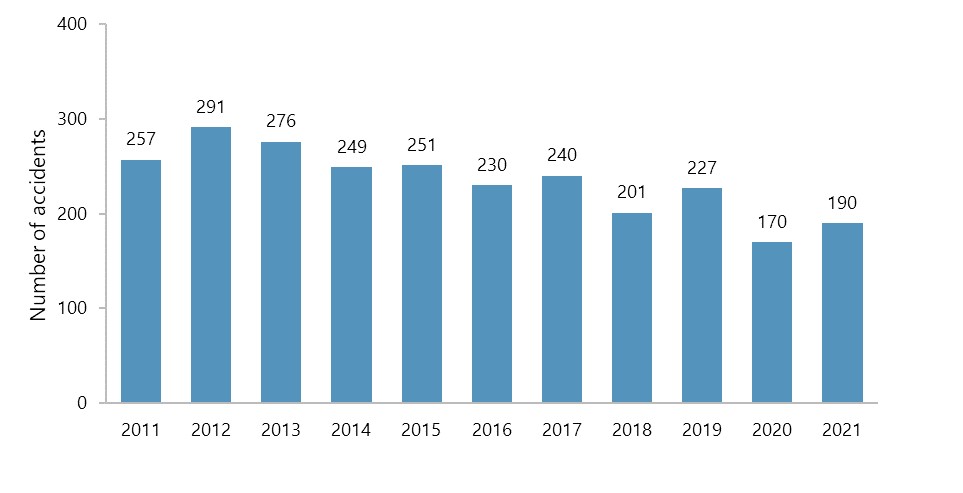
Figure 3. Data table
| Year | Number of Accidents |
|---|---|
| 2011 | 257 |
| 2012 | 291 |
| 2013 | 276 |
| 2014 | 249 |
| 2015 | 251 |
| 2016 | 230 |
| 2017 | 240 |
| 2018 | 201 |
| 2019 | 227 |
| 2020 | 170 |
| 2021 | 190 |
There were 169 accidents involving Canadian-registered aircraft (excluding ultralights) in 2021 (Table 2). This is above the 2020 count of 153 accidents, and 19% below the average of 209 accidents in the preceding 10 years (2011 to 2020). If the 20 accidents involving ultralights are included in the count, there were 189 accidents involving Canadian-registered aircraft in 2021.
Aircraft type
Of the 190 air transportation accidents reported to the TSB in 2021, 137 (72%) involved fixed-wing, powered airplanes (other than ultralights) (Table 1), 28 (15%) involved helicopters, 20 (11%) involved ultralights, and 6 accidents (3%) involved other types of aircraft. In the 10 years from 2011 to 2020, the average proportion of accidents involving each of these 4 types of aircraft has remained fairly constant: airplanes have been involved in roughly 75% of reportable accidents each year, helicopters in about 12% of accidents, ultralights in about 10%, and other aircraft in about 3% of accidents each year.
Operator type
There were 62 accidents that involved commercially-operated aircraft in 2021 (Table 1). This is 15% more than the 54 such accidents recorded in 2020, but 22% below the average of 79 accidents recorded in the 10 years 2011 to 2020.
Commercially-operated Canadian-registered airplanes were involved in 43 accidents in 2021 (Table 2 and Figure 4), and 4 of those involved operations under Canadian Aviation Regulations (CARs) Subpart 705, which certificates the operation of airliners. This is equal to the 4 accidents involving Canadian-registered airliners in 2020, and below the average of 6 accidents per year recorded from 2011 to 2020. In 2021, the TSB opened a class 3 investigation (A21Q0138) into 1 of the 4 accidents in that year that involved airliners.Footnote 5 This occurrence involved the failure of a main gear component during landing.
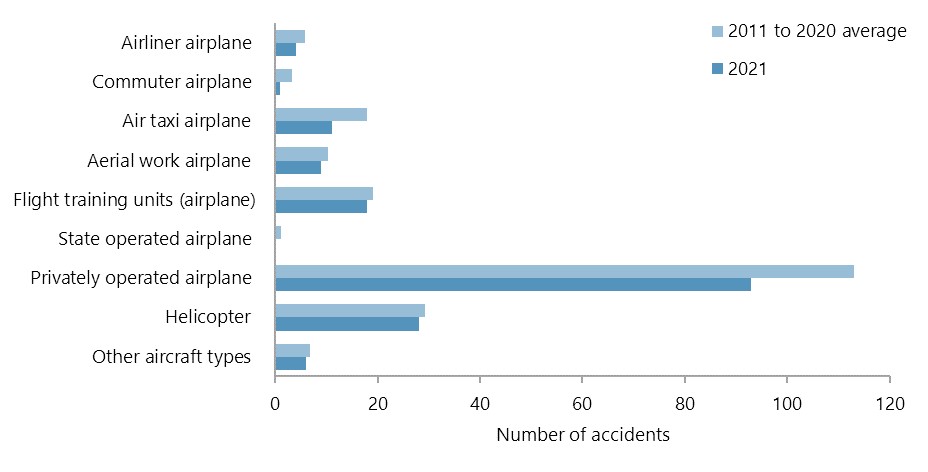
Figure 4. Data table
| Type of aircraft and operation | 2011 to 2020 average | 2021 |
|---|---|---|
| Other aircraft types | 7 | 6 |
| Helicopter | 29 | 28 |
| Privately operated airplane | 113 | 93 |
| State operated airplane | 1 | 0 |
| Flight training units (airplane) | 19 | 18 |
| Aerial work airplane | 10 | 9 |
| Air taxi airplane | 18 | 11 |
| Commuter airplane | 3 | 1 |
| Airliner airplane | 6 | 4 |
Also in 2021, there was 1 accident involving a Canadian-registered commuter airplane operating under CARs Subpart 704 (Table 2), as well as 18 accidents involving air taxi operations (CARs Subpart 703)—11 involving airplanes and 7 involving helicopters. These 18 air taxi accidents are more than the 13 seen in 2020, and remain well below the average of 28 accidents per year occurring between 2011 and 2020. Flight training units operating under CARs Subpart 406 were involved in 18 accidents in 2021, all of which involved airplanes (as opposed to helicopters). On average for the period 2011 to 2020, flight training units were involved in about 20 airplane and 1 helicopter accidents per year.
Overall in 2021, 127 air transportation accidents involved non-commercial (i.e., private aircraft) operations (Table 1), compared to 114 in the preceding year. The 2021 total is 18% below the annual average of 154 accidents from 2011 to 2020. Of the 127 total accidents in the non-commercial (private aircraft) operations category, 93 involved Canadian-registered airplanes (Table 2), with no accidents in 2021 involving an airplane operating under CARs Subpart 604 having a Private Operator Registration Document (PORD).
Most operators of non-commercial (private) Canadian-registered aircraft are classified as recreational. Recreational operators are responsible for a significant amount of flying activity, and tend to be involved in many accidents each year. In 2021, 126 accidents involved recreational operators of Canadian-registered aircraft—93 of them in fixed-wing airplanes (Table 2), 9 in helicopters, and 24 in other aircraft. These 126 accidents are 10% more than in the preceding year, but still 15% fewer than the 149 such accidents seen on average between 2011 and 2020.
In addition to commercial, and private operations, 1 accident in 2021 involved a state-operated remotely-piloted aircraft system (RPAS), or “drone”, and 1 additional accident was categorized as having an unknown operation type (Table 1).
Province or territory
Quebec and British Columbia, with 45 reported accidents each (all aircraft types, including ultralights), were the provinces with the largest number of reported accidents in 2021, surpassing Ontario with 35 (Table 7). Ontario averaged more accidents per year (60) in the 2011–2020 period than any other province or territory, with Quebec having the second-largest average accident count (51) for the same period. British Columbia and Alberta also have high average accident counts compared with the remaining provinces and territories.
Altogether, 6 accidents that were reportable under TSB Regulations occurred outside Canada in 2021. These all involved fixed-wing airplanes: 3 were operating commercially and 3 privately (recreational).
Focusing on Canadian-registered aircraft (excluding ultralights), most provinces saw fewer accidents reported in 2021 than average for the previous 10 years (Table 8 and Figure 5). British Columbia, with 41 accidents reported for the year, was the only location to have more accidents than the 10-year average (of 37).
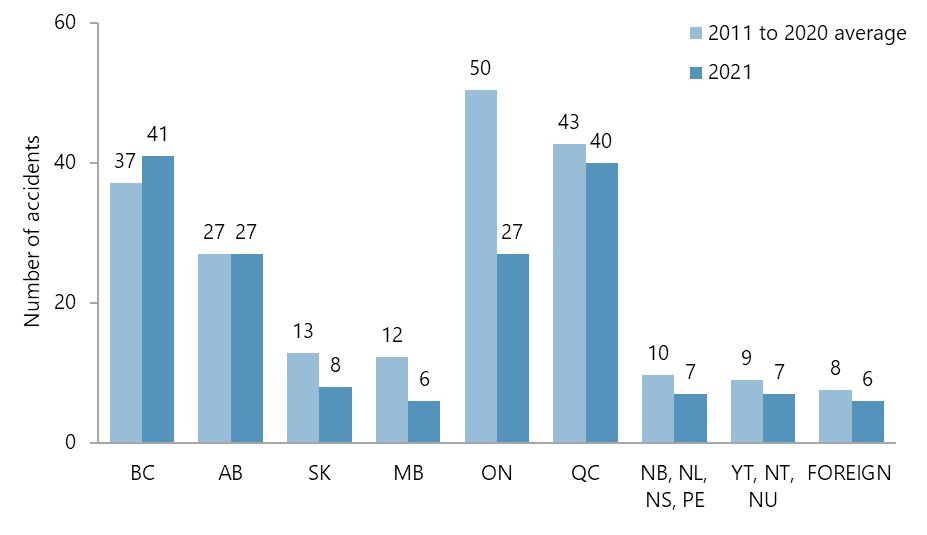
Figure 5. Data table
| Province or territory | 2011 to 2020 average | 2021 |
|---|---|---|
| BC | 37 | 41 |
| AB | 27 | 27 |
| SK | 13 | 8 |
| MB | 12 | 6 |
| ON | 50 | 27 |
| QC | 43 | 40 |
| NB, NL, NS, PE | 10 | 7 |
| YT, NT, NU | 9 | 7 |
| FOREIGN | 8 | 6 |
Fatal accidents, fatalities, and serious injuries
The TSB recorded 22 fatal air transportation accidents resulting in 32 fatalities in 2021 (tables 1 and 4, and Figure 6). This is up considerably from 12 fatal accidents resulting in 16 fatalities in 2020, but is still 21% below the average of 28 fatal accidents involving 47 fatalities over the ten years 2011 to 2020. Of the 22 fatal accidents in 2021, 14 involved fixed-wing, powered airplanes, 5 involved helicopters, and 3 involved ultralight aircraft. All of these occurrences involved Canadian-registered aircraft and all but two occurred in Canadian airspace. There were no fatal accidents in Canada during 2021 that involved foreign-registered aircraft.
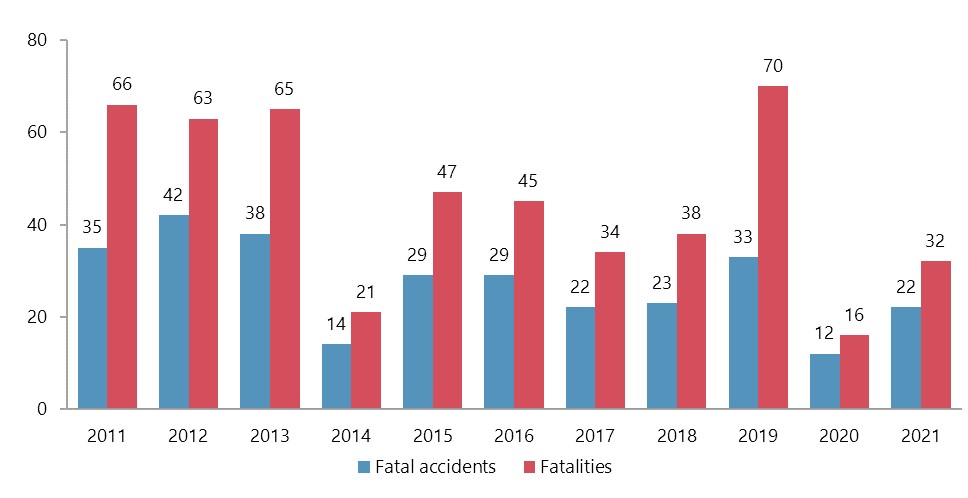
Figure 6. Data table
| Year | Fatalities | Fatal accidents |
|---|---|---|
| 2011 | 66 | 35 |
| 2012 | 63 | 42 |
| 2013 | 65 | 38 |
| 2014 | 21 | 14 |
| 2015 | 47 | 29 |
| 2016 | 45 | 29 |
| 2017 | 34 | 22 |
| 2018 | 38 | 23 |
| 2019 | 70 | 33 |
| 2020 | 16 | 12 |
| 2021 | 32 | 22 |
Eight of the 32 air transportation fatalities in 2021 involved commercial operations (Table 4): 1 of them under air taxi regulations (CARs 703), and 7 under aerial work (CARs 702). There were no fatalities involving airliner operations (CARs 705), commuter operations (CARs 704), or flight training operations (CARs 406) in 2021. The remaining 24 (of 32) fatalities in 2021 were linked to privately registered aircraft and involved recreational operators, with none involving an operator holding a PORD (CARs 604).
With regards to type of aircraft, 19 of 32 fatalities in 2021 resulted from accidents in fixed-wing powered airplanes (Table 4). Helicopter accidents resulted in 10 fatalities, and ultralight accidents accounted for 3 deaths. Of the 32 total fatalities, 18 were crew members and 11 were aircraft passengers. There were 3 fatalities among persons on the ground in 2021.
Overall, 44 persons received serious injuries in aircraft accidents in 2021 (Table 5), which is considerably more than the 18 persons seriously injured in 2020, and 41% above the average of 31 in the period 2011 to 2020. Twelve persons received serious injuries in accidents involving commercial operations in 2021: 3 in airliners (CARs 705), none in a commuter aircraft (CARs 704), 1 in the air taxi sector (CARs 703), 7 in aerial work operations (CARs 702), and 1 with a flight-training unit (CARs 406). The 7 persons seriously injured in aerial work operations is almost triple the yearly average of 2.4 serious injuries per year over the preceding 10 years. Also during 2021, 32 persons incurred serious injuries in recreational operations.
Accident rate
Accident rate as a key safety indicator
A key indicator of air transportation safety is the aircraft accident rate, which is calculated as the number of accidents per hours flown or per number of movements (a movement can be a takeoff or a landing). Analyzing trends of accident rates for different types of operators can signal emerging safety issues associated with specific operator types and activities.
Activity data (e.g., flight hours) broken out by operator typeFootnote 6 are required to calculate accident rates that enable trend analysis of specific operator types over time, or support comparisons across operator types or geographical regions.
Until 2010, Transport Canada provided activity data broken out by operator type, and the TSB used these data to calculate and publish accident rates across operator types. Since 2010, however, Transport Canada no longer provides hours-flown activity data breakouts by operator type, because it had concerns regarding the accuracy of those data, which, for some operators that operated under more than one subpart of the CARs, were collectively reported only under the most restrictive CARs subpart.
Reporting all hours for all subparts under a single total conflates and confounds airline and commuter activity, as well as the activity of many smaller air operators that carry out operations under multiple subparts of the CARs (commuter, air taxi, and/or aerial work) and report their activity as a single total. Furthermore, movement data as presently reported by Statistics CanadaFootnote 7 come from a survey that covers all aircraft movements at major Canadian airports with NAV CANADA air traffic control towers and flight service stations, but as of April 2020, Statistics Canada no longer collects data about movements at small airports without towers or flight service stations, and so activity at smaller airports is not reflected in the data.
Because hours-flown and movement data are currently not categorized by CARs subpart when collected by the Canadian government, there is no differentiation between sectors (e.g., air-taxi operators versus airline operators) or between different types of aircraft (airplane, helicopter, floatplane). Therefore, accident rates cannot be calculated for individual sectors of the industry.
Without hours-flown and movement data that are categorized by CARs subpart and aircraft type, it will be more difficult for sector stakeholders to assess risks and determine if mitigation strategies being carried out to improve safety are actually working.
Therefore, in 2019 the Board recommended that
the Department of Transport require all commercial operators to collect and report hours flown and movement data for their aircraft by Canadian Aviation Regulations subpart and aircraft type, and that the Department of Transport publish those data.
TSB Recommendation A19-05
Accident rate for Canadian-registered aircraft, in Canada and abroad, per 100 000 hours flown
Overall accident rate
Transport Canada collects information about the number of hours flown by Canadian-registered aircraft. The 2021 overall air transportation accident rate of 4.8 per 100 000 hours flown (Table 3) was calculated based on the 164 accidents (15% more than 2020) in Canada and abroad involving Canadian-registered airplanes and helicopters (ultralights and other aircraft types are excluded), and the estimated 3 422 000 hours flown by Canadian-registered aircraft (10% above the revised estimate for 2020).Footnote 8 This rate is equal to the 2020 rate of 4.8 accidents per 100 000 flight hours, and only slightly (4%) above the average rate of 4.6 accidents per 100 000 hours flown each year over the previous 10 years. While the number of hours flown in 2021 increased by 10% compared to 2020, the number of reported accidents increased by a similar amount – around 10%. Taken together this means the accident rate statistic held steady.
Despite the accident rate rising in 2019 and 2020, it remains statistically plausible that the accident rate for Canadian-registered aircraft has been trending generally downward over the past 11 years. The accident rate has fallen from 5.3 accidents per 100 000 hours flown in 2011 to a low of 3.4 in 2018 before rising again to 4.8 during 2020 and 2021. To test whether the change in rate was statistically significant, Kendall’s tau-b (τb) correlation and Sen’s estimate of slope were used to quantify the trend in Canadian-registered aircraft accident rate and fatal accident rate. Kendall's τb correlation coefficient is a nonparametric measure of the strength and direction of association that exists between two variables. Kendall’s τb was calculated on the 11-year series of accident rate values by year from 2011 to 2021. There was a moderate, statistically significant negative correlation that indicates a downward trend in accident rate per 100 000 hours flown over the period (τb = −0.4909, p = 0.0356). Sen’s estimate of slope, the amount of downward rate change per year, was −0.103 occurrences per 100 000 hours flown per year. A graphical illustration is presented in Figure 7.
Fatal accidents
Figure 7 also shows rate data for fatal accidents. For the 19 fatal accidents involving Canadian-registered airplanes and helicopters in 2021 (ultralights and other aircraft types are excluded), the fatal accident rate was 0.6 per 100 000 hours flown, which is up from the 2020 rate of 0.3, and is above the 2011 to 2020 average of 0.5 fatal accidents per 100 000 hours flown. There is no statistically significant change in the fatal accident rate since 2011 (Kendall’s τb = −0.3091, p = 0.1857).
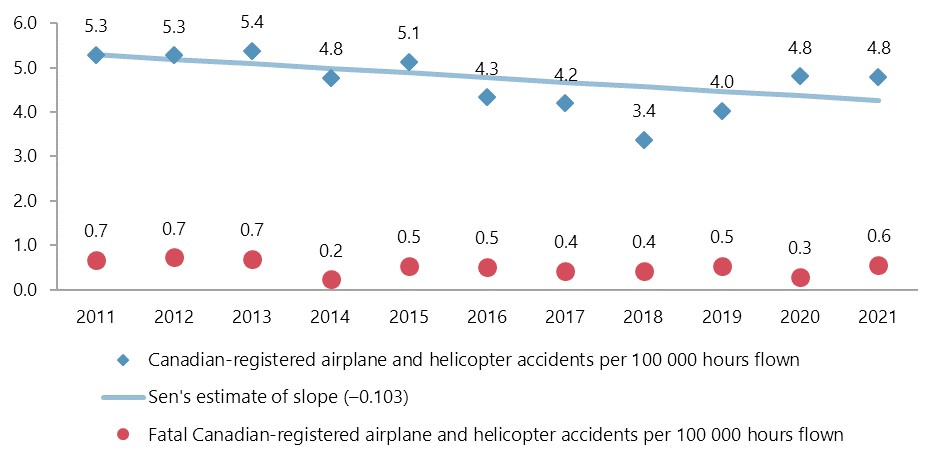
Figure 7. Data table
| Year | Canadian-registered airplane and helicopter accidents per 100 000 hours flown | Sen's estimate of slope (–0.103) | Fatal Canadian-registered airplane and helicopter accidents per 100 000 hours flown | Sen's estimate of slope (−0.030) |
|---|---|---|---|---|
| 2011 | 5.3 | 5.3 | 0.7 | 0.7 |
| 2012 | 5.3 | 5.2 | 0.7 | 0.6 |
| 2013 | 5.4 | 5.1 | 0.7 | 0.6 |
| 2014 | 4.8 | 5.0 | 0.2 | 0.6 |
| 2015 | 5.1 | 4.9 | 0.5 | 0.5 |
| 2016 | 4.3 | 4.8 | 0.5 | 0.5 |
| 2017 | 4.2 | 4.7 | 0.4 | 0.5 |
| 2018 | 3.4 | 4.6 | 0.4 | 0.5 |
| 2019 | 4.0 | 4.5 | 0.5 | 0.4 |
| 2020 | 4.8 | 4.4 | 0.3 | 0.4 |
| 2021 | 4.8 | 4.3 | 0.6 | 0.4 |
Fatalities
In 2021, 29 fatalities resulted from accidents involving Canadian-registered airplanes and helicopters (excluding ultralights), yielding a rate of 0.8 fatalities per 100 000 hours flown. This fatality rate is higher than the 2020 rate of 0.4, and slightly below the average yearly rate of 0.9 from 2011 to 2020. There is no statistically significant trend (neither upward nor downward) in the fatality rate since 2011 (Kendall’s τb = −0.3818, p = 0.1021) (data not shown).
Accident rate per 100 000 aircraft movements in Canada, for Canadian and foreign-registered aircraft
Although data describing the number of aircraft movements at major airports are published by Statistics Canada, since 2020 no data about activity at small airports in Canada have been published or made available to the TSB. Without a complete picture to describe aircraft movements in Canada, the TSB cannot state an overall accident rate per 100 000 aircraft movements in Canada. As discussed in TSB Recommendation A19-05 (see above), and without movement data that are categorized by CARs subpart and aircraft type, it will be difficult for sector stakeholders to assess risks and determine if mitigation strategies being carried out to improve safety are effective.
Dangerous goods released
The TSB recorded 8 accidents in 2021 involving a release of dangerous goods (Table 1). This is above the average of 4.6 per year over the previous 10 years.
Accident events and phases
For each reported accident, the TSB records 1 or more safety-significant events that occurred, and the phase of flight for each of these events. For example, if an airplane suffers engine power loss during takeoff (safety-significant event 1), and then returns to land and has a runway excursion during landing (safety-significant event 2), each of the two events and their phase of flight will be recorded for statistical purposes. Tables 11 through 14 show, by phase of flight, how many accidents occurred for each event category, from 2011 to 2021. Note that if a single accident involves more than one event within a phase of flight, that accident is only counted once in the phase total. Therefore, the total number of accidents for each event within a phase will not necessarily sum to the total number of accidents for a phase. For example, in the "takeoff" phase, if an accident involves both "loss of control" and "power loss" events, the accident is counted once in each event category within the phase, but only once in the overall phase total. As well, approximately 30% of accidents from 2011 to 2021 involved events in more than a single phase of flight, so the number of accidents shown in the tables, and in figures 8 and 9, sum to more than the total number of accidents.
Figures 8 and 9 show the number of airplane and helicopter accidents by phase of flight and event category. Over the past 11 years (2011 to 2021), the distribution of airplane accidents (Table 11 and Figure 8) shows more accidents having events during the landing phase (83 of 137, or 61% of airplane accidents) or takeoff phase (40 of 137, or 29%) than in other phases of flight. Helicopter accidents (Table 12 and Figure 9) had events occurring most often during the landing (12 of 28, or 43%), manoeuveringFootnote 9 (9 of 28; 32%), and takeoff (8 of 28; 29%) phases of flight. Note that for airplanes, although the landing phase is associated with the largest outright number of accidents over the 11-year period, the en route (67) and takeoff phases (56) are associated with the largest numbers of fatal accidents (Table 13 and Figure 9), and manoeuvering with the largest proportion of fatal accidents (36 of 119; 30%). Similarly, for helicopters, the en route (20) and manoeuvering (19) phases are linked to more fatal accidents in the 11-year period than are the approach (3) and landing (7) phases of flight (Table 14 and Figure 10).
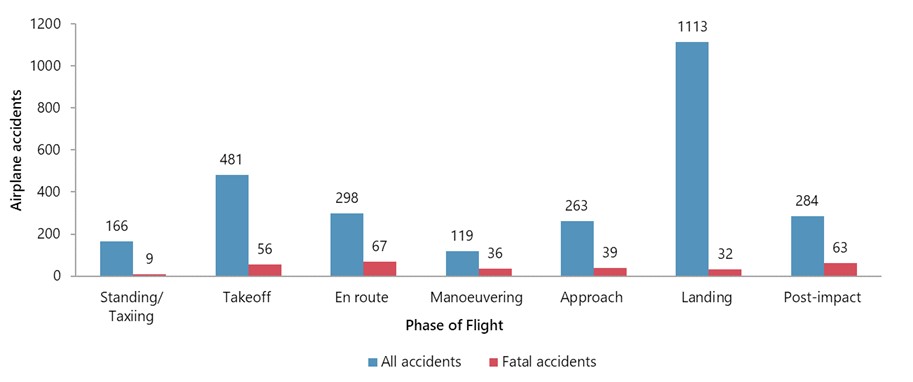
Figure 8. Data table
| Phase of flight | All accidents | Fatal accidents |
|---|---|---|
| Standing/Taxiing | 166 | 9 |
| Takeoff | 481 | 56 |
| En route | 298 | 67 |
| Manoeuvering | 119 | 36 |
| Approach | 263 | 39 |
| Landing | 1113 | 32 |
| Post-impact | 284 | 63 |
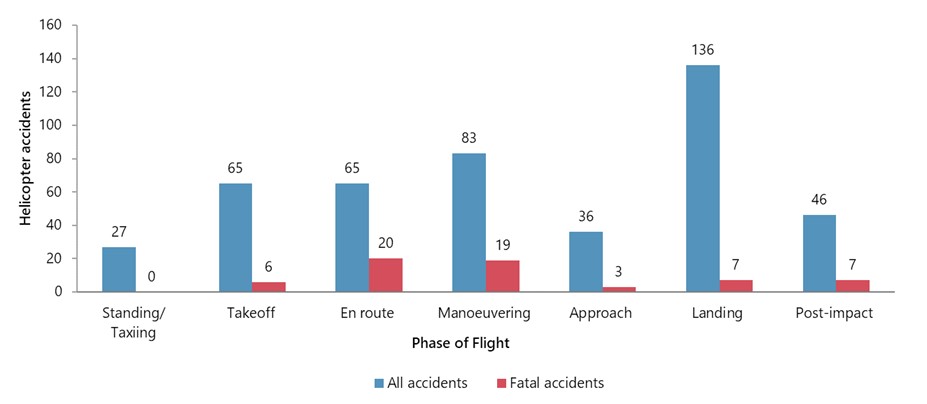
Figure 9. Data table
| Phase of flight | All accidents | Fatal accidents |
|---|---|---|
| Standing/Taxiing | 27 | 0 |
| Takeoff | 65 | 6 |
| En route | 65 | 20 |
| Manoeuvering | 83 | 19 |
| Approach | 36 | 3 |
| Landing | 136 | 7 |
| Post-impact | 46 | 7 |
Overview of incidents
Incident counts
In 2021, 499 air transportation incidents of all types were reported in accordance with the TSB Regulations (Table 9). This represents an increase of 19% from the 421 that were reported in 2020, and is 34% below the average of 751 incidents per year between 2011 and 2020. In the mid part of the past decade incident counts had been generally increasing, which reflected both an increase in commercial flying activity and the introduction of new TSB reporting regulations that became effective July 1, 2014. Under these reporting requirements, air transportation incidents to be reported to the TSB were expanded to include aircraft with a maximum certificated takeoff weight greater than 2250 kg (formerly 5700 kg) and aircraft being operated with an air operator certificate issued under CARs Part VII—Commercial Air Services. At the onset of the COVID-19 pandemic in early 2020, both commercial flying activity and the number of reported incidents were greatly reduced.
Overall, 2021 saw a gradual increase in commercial air traffic in Canada,Footnote 10 and with it a gradual rise in reported air transportation incidents. While declared emergency (205 incidents) is still the most frequently reported incident category in 2021 (Table 9 and Figure 10), it should be noted that this category is somewhat a catch-all category for incidents where an emergency is declared and no other primary category (as set out in the TSB Regulations) applies. Risk of collision / loss of separation (ROC/LOS) incidents (62) decreased in proportion from a peak of 18% of all incidents in 2017 to about 12% of incidents in 2021. Incidents involving engine failure (83) rose in 2021 to about 17% of all incidents. Amongst the 20% of ‘other’ incident types, crew were reported to have been unable to perform their duties 16 times, or in 3% of all reportable incidents in the year, down from 34 incidents (8%) in the previous year. This category includes both flight crew and cabin crew.
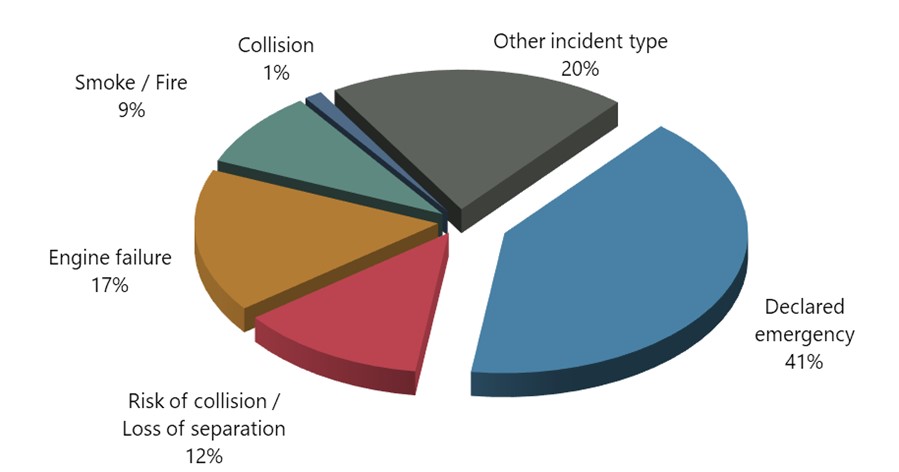
Figure 10. Data table
| Incident type | Number | Percentage |
|---|---|---|
| Declared emergency | 205 | 41% |
| Risk of collision / Loss of separation | 62 | 12% |
| Engine failure | 83 | 17% |
| Smoke / Fire | 44 | 9% |
| Collision | 6 | 1% |
| Other incident type | 99 | 20% |
The majority of air transportation incidents in 2021 (401 or 80%) occurred in Canada and involved Canadian-registered aircraft (Table 1). However, 72 incidents involving Canadian-registered aircraft occurred outside Canada in 2021. While this count is higher than the 66 incidents outside Canada in 2020, it contrasts with the peak of 181 in 2017 (and again in 2019), and the average of 96 per year in the 10 years from 2011 to 2020. Declared emergency and risk of collision/loss of separation (ROC/LOS) were the two most common incident types involving Canadian-registered aircraft outside of Canada (Table 1). Both of these incident types have increased in frequency in recent years. The TSB continues to monitor these trends moving forward.
The overall increase in reportable incidents is at least partially linked to improvements in reporting culture in the airline industry, and the adoption of safety management systems by many smaller commercial operators (in addition to all of the major Canadian airlines), and the increased use of electronic flight bags and portable devices, which make it easier for pilots to report incidents.
In part due to reporting requirements laid out in the TSB Regulations, commercial operations were the source of 461 (92%) of the 499 incidents reported to the TSB in 2021 (Table 9). More than half (246, or 53%) of these involved Canadian-registered airliners operating under CARs Subpart 705 (airline operations) (tables 9 and 10). This is down from a peak of 614 in 2017, and 47% fewer than the average of 461 incidents per year from 2011 to 2020 that involved Canadian-registered airliners.
Foreign air operators (CARs 701) were involved in just 27 incidents in 2021, or about 5% of all commercial incidents. This is fewer than the 32 incidents recorded in 2020, and was largely because of the continued reduction in transborder and international passenger traffic brought about by COVID-19 restrictions. Footnote 11
Data tables
| 2011 | 2012 | 2013 | 2014 | 2015 | 2016 | 2017 | 2018 | 2019 | 2020 | 2021 | |
|---|---|---|---|---|---|---|---|---|---|---|---|
| Accidents | 257 | 291 | 276 | 249 | 251 | 230 | 240 | 201 | 227 | 170 | 190 |
| Accidents in Canada involving Canadian-registered aircraft | 241 | 267 | 262 | 238 | 232 | 214 | 222 | 180 | 210 | 165 | 183 |
| Accidents outside Canada involving Canadian-registered aircraft | 6 | 8 | 4 | 4 | 10 | 8 | 11 | 11 | 8 | 5 | 6 |
| Accidents in Canada involving foreign-registered aircraft | 10 | 17 | 10 | 7 | 9 | 8 | 7 | 11 | 10 | 0 | 1 |
| Accidents1 | 257 | 291 | 276 | 249 | 251 | 230 | 240 | 201 | 227 | 170 | 190 |
| Commercial | 99 | 92 | 84 | 82 | 74 | 63 | 97 | 66 | 83 | 54 | 62 |
| Airliner (CARs 705) | 4 | 5 | 7 | 4 | 9 | 1 | 9 | 8 | 7 | 4 | 4 |
| Commuter (CARs 704) | 6 | 5 | 3 | 2 | 3 | 3 | 5 | 1 | 4 | 3 | 1 |
| Air taxi (CARs 703) | 38 | 33 | 33 | 34 | 23 | 26 | 28 | 23 | 26 | 13 | 18 |
| Aerial work (CARs 702) | 27 | 26 | 21 | 17 | 18 | 16 | 18 | 17 | 21 | 13 | 21 |
| Foreign air operator (CARs 701) | 2 | 2 | 2 | 0 | 0 | 0 | 4 | 3 | 1 | 0 | 0 |
| Flight training units (CARs 406) | 19 | 19 | 17 | 25 | 20 | 17 | 32 | 13 | 25 | 20 | 18 |
| Other commercial | 3 | 3 | 1 | 1 | 1 | 1 | 2 | 1 | 0 | 1 | 0 |
| Private | 149 | 185 | 179 | 159 | 172 | 164 | 142 | 134 | 143 | 114 | 127 |
| Private operators (CARs 604) | 5 | 3 | 4 | 3 | 0 | 5 | 0 | 3 | 1 | 2 | 0 |
| Recreational | 142 | 181 | 175 | 156 | 165 | 152 | 135 | 126 | 136 | 109 | 124 |
| Other private | 3 | 1 | 0 | 0 | 7 | 8 | 7 | 7 | 6 | 3 | 3 |
| State | 2 | 3 | 6 | 4 | 1 | 0 | 0 | 2 | 1 | 1 | 1 |
| Other/Unknown | 8 | 12 | 9 | 5 | 5 | 3 | 2 | 0 | 0 | 1 | 1 |
| Accidents1 | 257 | 291 | 276 | 249 | 251 | 230 | 240 | 201 | 227 | 170 | 190 |
| Airplane | 201 | 205 | 212 | 176 | 197 | 174 | 178 | 153 | 176 | 133 | 137 |
| Helicopter | 36 | 41 | 27 | 34 | 33 | 28 | 27 | 26 | 28 | 16 | 28 |
| Ultralight | 17 | 36 | 23 | 32 | 17 | 22 | 25 | 18 | 18 | 17 | 20 |
| Other2 | 3 | 9 | 15 | 8 | 7 | 6 | 10 | 4 | 6 | 4 | 6 |
| Aircraft involved in accidents1,3 | 261 | 296 | 280 | 253 | 259 | 234 | 247 | 207 | 230 | 172 | 194 |
| Airplane | 204 | 209 | 215 | 179 | 202 | 178 | 184 | 159 | 178 | 135 | 140 |
| Helicopters | 36 | 42 | 27 | 34 | 33 | 28 | 27 | 26 | 28 | 16 | 28 |
| Ultralights | 17 | 36 | 23 | 32 | 17 | 22 | 25 | 18 | 18 | 17 | 20 |
| Other2 | 4 | 9 | 15 | 8 | 7 | 6 | 11 | 4 | 6 | 4 | 6 |
| Fatal accidents1 | 35 | 42 | 38 | 14 | 29 | 29 | 22 | 23 | 33 | 12 | 22 |
| Airplane | 23 | 25 | 25 | 12 | 20 | 22 | 18 | 17 | 27 | 7 | 14 |
| Helicopter | 8 | 7 | 6 | 0 | 5 | 2 | 2 | 4 | 3 | 2 | 5 |
| Ultralight | 3 | 8 | 4 | 2 | 4 | 4 | 1 | 2 | 3 | 3 | 3 |
| Other2 | 1 | 2 | 4 | 0 | 0 | 1 | 1 | 0 | 1 | 0 | 0 |
| Persons fatally injured in reportable accidents | 66 | 63 | 65 | 21 | 47 | 45 | 34 | 38 | 70 | 16 | 32 |
| Persons seriously injured in reportable accidents | 49 | 48 | 22 | 35 | 31 | 18 | 33 | 28 | 31 | 18 | 44 |
| Accidents in Canada involving foreign-registered aircraft | 10 | 17 | 10 | 7 | 9 | 8 | 7 | 11 | 10 | 0 | 1 |
| Fatal accidents | 2 | 1 | 2 | 2 | 3 | 1 | 0 | 0 | 4 | 0 | 0 |
| Persons fatally injured | 2 | 1 | 2 | 4 | 4 | 7 | 0 | 0 | 11 | 0 | 0 |
| Persons seriously injured | 1 | 4 | 0 | 1 | 0 | 0 | 0 | 4 | 1 | 0 | 0 |
| Occurrences with a dangerous good release | 0 | 1 | 4 | 4 | 6 | 7 | 8 | 7 | 8 | 1 | 8 |
| Incidents4 | 673 | 645 | 689 | 741 | 789 | 833 | 939 | 860 | 915 | 421 | 499 |
| Incidents in Canada involving Canadian-registered aircraft | 519 | 482 | 541 | 599 | 653 | 620 | 685 | 608 | 654 | 319 | 401 |
| Incidents outside Canada involving Canadian-registered aircraft | 54 | 48 | 38 | 55 | 58 | 117 | 181 | 161 | 181 | 66 | 72 |
| Incidents in Canada involving foreign-registered aircraft | 126 | 138 | 129 | 102 | 106 | 117 | 106 | 115 | 113 | 43 | 30 |
| Incidents4 | 673 | 645 | 689 | 741 | 789 | 833 | 939 | 860 | 915 | 421 | 499 |
| Risk of collision / Loss of separation | 120 | 102 | 115 | 94 | 111 | 139 | 172 | 141 | 138 | 48 | 62 |
| Declared emergency | 275 | 266 | 294 | 313 | 333 | 311 | 348 | 340 | 366 | 190 | 205 |
| Engine failure | 95 | 92 | 83 | 104 | 110 | 110 | 98 | 91 | 103 | 50 | 83 |
| Smoke/Fire | 88 | 71 | 67 | 89 | 87 | 85 | 100 | 99 | 91 | 25 | 44 |
| Collision | 7 | 5 | 15 | 16 | 8 | 18 | 24 | 26 | 31 | 8 | 6 |
| Other | 88 | 109 | 115 | 125 | 140 | 170 | 197 | 163 | 186 | 100 | 99 |
Data extracted 15 March 2022 1 Breakdowns may not add up to totals. For example, when an occurrence involves an airplane and a helicopter, the occurrence is counted in each type, but only once in the total. 2 Includes balloons, gyroplanes, gliders, airships, hang gliders, remotely piloted aircraft systems (RPAS) and similar aircraft types. 3 "Aircraft involved in accidents" are aircraft counts, all other data are accident counts. 4 Under the 2014 TSB Regulations, reportable aviation incidents include a) aircraft having a maximum certificated take-off weight greater than 2250 kg (formerly 5700 kg); b) aircraft being operated under an air operator certificate issued under the Canadian Aviation Regulations, Part VII. |
|||||||||||
| 2011 | 2012 | 2013 | 2014 | 2015 | 2016 | 2017 | 2018 | 2019 | 2020 | 2021 | |
|---|---|---|---|---|---|---|---|---|---|---|---|
| Accidents1,2 | 230 | 239 | 243 | 212 | 227 | 200 | 208 | 173 | 200 | 153 | 169 |
| Airplane accidents | 192 | 191 | 204 | 170 | 190 | 167 | 171 | 143 | 168 | 133 | 136 |
| Commercial | 71 | 62 | 58 | 55 | 51 | 42 | 71 | 46 | 66 | 45 | 43 |
| Airliner (CARs 705) | 4 | 5 | 7 | 4 | 9 | 1 | 9 | 8 | 7 | 4 | 4 |
| Commuter (CARs 704) | 4 | 5 | 3 | 1 | 3 | 3 | 5 | 1 | 4 | 3 | 1 |
| Air taxi (CARs 703) | 27 | 19 | 19 | 19 | 12 | 16 | 18 | 18 | 21 | 10 | 11 |
| Aerial work (CARs 702) | 14 | 14 | 12 | 8 | 10 | 7 | 12 | 6 | 11 | 8 | 9 |
| Flight training units (CARs 406) | 19 | 18 | 16 | 23 | 16 | 16 | 27 | 12 | 23 | 20 | 18 |
| Other commercial | 3 | 1 | 1 | 0 | 1 | 0 | 0 | 1 | 0 | 0 | 0 |
| Private | 113 | 122 | 139 | 111 | 138 | 122 | 101 | 96 | 101 | 88 | 93 |
| Private operators (CARs 604) | 2 | 0 | 3 | 1 | 0 | 5 | 0 | 3 | 1 | 2 | 0 |
| Recreational | 110 | 121 | 136 | 110 | 132 | 114 | 98 | 92 | 97 | 83 | 91 |
| Other private | 2 | 1 | 0 | 0 | 6 | 4 | 3 | 2 | 3 | 3 | 2 |
| State | 2 | 1 | 2 | 3 | 1 | 0 | 0 | 2 | 1 | 0 | 0 |
| Other/Unknown | 6 | 6 | 7 | 2 | 1 | 3 | 0 | 0 | 0 | 0 | 0 |
| Helicopter accidents | 35 | 41 | 27 | 34 | 32 | 27 | 27 | 26 | 27 | 16 | 28 |
| Commercial | 26 | 28 | 22 | 26 | 23 | 18 | 22 | 17 | 16 | 9 | 19 |
| Private | 9 | 10 | 4 | 7 | 9 | 9 | 5 | 9 | 11 | 6 | 9 |
| State | 0 | 2 | 1 | 1 | 0 | 0 | 0 | 0 | 0 | 1 | 0 |
| Other/Unknown | 0 | 2 | 0 | 0 | 0 | 0 | 0 | 0 | 0 | 0 | 0 |
| Other aircraft accidents3 | 3 | 7 | 13 | 8 | 7 | 6 | 10 | 4 | 6 | 4 | 6 |
| Fatal accidents1,2 | 30 | 33 | 32 | 10 | 23 | 24 | 21 | 21 | 26 | 9 | 19 |
| Airplane accidents | 21 | 25 | 24 | 10 | 18 | 21 | 18 | 17 | 23 | 7 | 14 |
| Commercial | 11 | 6 | 8 | 2 | 6 | 3 | 7 | 4 | 8 | 1 | 2 |
| Airliner (CARs 705) | 1 | 0 | 0 | 0 | 0 | 0 | 1 | 0 | 0 | 0 | 0 |
| Commuter (CARs 704) | 1 | 1 | 1 | 0 | 0 | 0 | 0 | 0 | 0 | 0 | 0 |
| Air taxi (CARs 703) | 6 | 3 | 5 | 1 | 3 | 1 | 1 | 2 | 6 | 1 | 0 |
| Aerial work (CARs 702) | 2 | 2 | 1 | 1 | 2 | 1 | 2 | 2 | 1 | 0 | 2 |
| Flight training units (CARs 406) | 1 | 0 | 1 | 0 | 1 | 1 | 3 | 0 | 1 | 0 | 0 |
| Other commercial | 0 | 0 | 0 | 0 | 0 | 0 | 0 | 0 | 0 | 0 | 0 |
| Private | 10 | 17 | 14 | 8 | 13 | 18 | 11 | 13 | 15 | 6 | 12 |
| Private operators (CARs 604) | 0 | 0 | 1 | 0 | 0 | 1 | 0 | 1 | 0 | 0 | 0 |
| Recreational | 10 | 17 | 13 | 8 | 13 | 16 | 10 | 13 | 15 | 6 | 12 |
| Other private | 0 | 0 | 0 | 0 | 0 | 1 | 1 | 0 | 0 | 0 | 0 |
| State | 0 | 0 | 0 | 0 | 0 | 0 | 0 | 0 | 0 | 0 | 0 |
| Other/Unknown | 0 | 2 | 2 | 0 | 0 | 0 | 0 | 0 | 0 | 0 | 0 |
| Helicopter accidents | 8 | 7 | 6 | 0 | 5 | 2 | 2 | 4 | 3 | 2 | 5 |
| Commercial | 6 | 5 | 6 | 0 | 4 | 1 | 2 | 1 | 1 | 1 | 4 |
| Private | 2 | 1 | 0 | 0 | 1 | 1 | 0 | 3 | 2 | 1 | 1 |
| State | 0 | 1 | 0 | 0 | 0 | 0 | 0 | 0 | 0 | 0 | 0 |
| Other/Unknown | 0 | 0 | 0 | 0 | 0 | 0 | 0 | 0 | 0 | 0 | 0 |
| Other aircraft accidents3 | 1 | 1 | 3 | 0 | 0 | 1 | 1 | 0 | 1 | 0 | 0 |
| Persons fatally injured2 | 61 | 54 | 59 | 15 | 40 | 34 | 33 | 36 | 54 | 13 | 29 |
| Persons seriously injured2 | 43 | 38 | 19 | 28 | 28 | 17 | 27 | 21 | 26 | 14 | 36 |
| Incidents2,4 | 573 | 530 | 579 | 654 | 711 | 737 | 866 | 769 | 835 | 385 | 472 |
| Risk of collision / Loss of separation | 106 | 92 | 105 | 84 | 101 | 127 | 159 | 134 | 128 | 47 | 61 |
| Declared emergency | 224 | 200 | 231 | 277 | 290 | 263 | 316 | 298 | 318 | 170 | 192 |
| Engine failure | 87 | 77 | 70 | 94 | 102 | 102 | 88 | 79 | 96 | 44 | 78 |
| Smoke/Fire | 67 | 59 | 55 | 76 | 79 | 75 | 95 | 85 | 83 | 21 | 41 |
| Collision | 7 | 4 | 14 | 15 | 7 | 16 | 23 | 21 | 27 | 8 | 6 |
| Other | 82 | 98 | 104 | 108 | 132 | 154 | 185 | 152 | 183 | 95 | 94 |
| Accidents involving ultralight aircraft | 17 | 36 | 23 | 31 | 16 | 22 | 25 | 18 | 18 | 17 | 20 |
| Fatal accidents | 3 | 8 | 4 | 2 | 3 | 4 | 1 | 2 | 3 | 3 | 3 |
| Fatalities | 3 | 8 | 4 | 2 | 3 | 4 | 1 | 2 | 5 | 3 | 3 |
| Serious injuries | 5 | 6 | 3 | 6 | 3 | 1 | 6 | 3 | 4 | 4 | 8 |
|
Data extracted 15 March 2022 1 Breakdowns may not add up to totals. For example, when an occurrence involves an airplane and a helicopter, the occurrence is counted in each type, but only once in the total. 2 Excludes ultralight aircraft. 3 Includes balloons, gyroplanes, gliders, airships, hang gliders, remotely piloted aircraft systems (RPAS) and similar aircraft types. 4 Under the 2014 TSB Regulations, reportable aviation incidents include a) aircraft having a maximum certificated take-off weight greater than 2250 kg (formerly 5700 kg); b) aircraft being operated under an air operator certificate issued under the Canadian Aviation Regulations, Part VII. |
|||||||||||
| 2011 | 2012 | 2013 | 2014 | 2015 | 2016 | 2017 | 2018 | 2019 | 2020 | 2021 | |
|---|---|---|---|---|---|---|---|---|---|---|---|
| Accidents | 227 | 232 | 231 | 204 | 222 | 194 | 198 | 169 | 195 | 149 | 164 |
| Fatal accidents | 29 | 32 | 30 | 10 | 23 | 23 | 20 | 21 | 26 | 9 | 19 |
| Fatalities | 59 | 53 | 57 | 15 | 40 | 33 | 32 | 36 | 54 | 13 | 29 |
| Hours flown2 (thousands) | 4 286 | 4 394 | 4 295 | 4 272 | 4 324 | 4 475 | 4 719 | 5 016 | 4 844 | 3 098 | 3 422 |
| Accidents per 100 000 hours | 5.3 | 5.3 | 5.4 | 4.8 | 5.1 | 4.3 | 4.2 | 3.4 | 4.0 | 4.8 | 4.8 |
| Fatal accidents per 100 000 hours | 0.7 | 0.7 | 0.7 | 0.2 | 0.5 | 0.5 | 0.4 | 0.4 | 0.5 | 0.3 | 0.6 |
| Fatalities per 100 000 hours | 1.4 | 1.2 | 1.3 | 0.4 | 0.9 | 0.7 | 0.7 | 0.7 | 1.1 | 0.4 | 0.8 |
|
Data extracted 15 March 2022 1 Canadian-registered aircraft, excluding ultralights, balloons, gyroplanes, gliders, airships, hang gliders and similar aircraft types. 2 Hours flown in 2019 to 2021 are estimates. Source: Transport Canada, email to TSB on 2022-03-23. |
|||||||||||
| 2011 | 2012 | 2013 | 2014 | 2015 | 2016 | 2017 | 2018 | 2019 | 2020 | 2021 | |
|---|---|---|---|---|---|---|---|---|---|---|---|
| Persons fatally injured | 66 | 63 | 65 | 21 | 47 | 45 | 34 | 38 | 70 | 16 | 32 |
| In Canada, involving Canadian-registered aircraft | 63 | 61 | 57 | 15 | 39 | 35 | 32 | 28 | 57 | 16 | 30 |
| Outside Canada, involving Canadian-registered aircraft | 1 | 1 | 6 | 2 | 4 | 3 | 2 | 10 | 2 | 0 | 2 |
| In Canada, involving foreign-registered aircraft | 2 | 1 | 2 | 4 | 4 | 7 | 0 | 0 | 11 | 0 | 0 |
| Persons fatally injured | 66 | 63 | 65 | 21 | 47 | 45 | 34 | 38 | 70 | 16 | 32 |
| Commercial | 40 | 18 | 29 | 4 | 20 | 6 | 15 | 9 | 25 | 2 | 8 |
| Airliner (CARs 705) | 12 | 0 | 0 | 0 | 0 | 0 | 1 | 0 | 0 | 0 | 0 |
| Commuter (CARs 704) | 2 | 1 | 5 | 0 | 0 | 0 | 0 | 0 | 0 | 0 | 0 |
| Air taxi (CARs 703) | 16 | 12 | 19 | 2 | 12 | 1 | 1 | 5 | 21 | 1 | 1 |
| Aerial work (CARs 702) | 8 | 3 | 4 | 2 | 6 | 2 | 7 | 4 | 3 | 1 | 7 |
| Foreign air operator (CARs 701) | 0 | 0 | 0 | 0 | 0 | 0 | 0 | 0 | 0 | 0 | 0 |
| Flight training units (CARs 406) | 2 | 1 | 1 | 0 | 2 | 3 | 5 | 0 | 1 | 0 | 0 |
| Other commercial | 0 | 1 | 0 | 0 | 0 | 0 | 1 | 0 | 0 | 0 | 0 |
| Private | 25 | 37 | 33 | 17 | 28 | 39 | 19 | 29 | 45 | 14 | 24 |
| Private operators (CARs 604) | 2 | 0 | 1 | 0 | 0 | 4 | 0 | 1 | 0 | 0 | 0 |
| Recreational | 23 | 37 | 32 | 17 | 28 | 27 | 17 | 29 | 43 | 14 | 24 |
| Other private | 0 | 0 | 0 | 0 | 0 | 8 | 2 | 0 | 2 | 0 | 0 |
| State | 0 | 1 | 0 | 0 | 0 | 0 | 0 | 0 | 0 | 0 | 0 |
| Other/Unknown | 3 | 7 | 3 | 0 | 1 | 0 | 0 | 0 | 0 | 0 | 0 |
| Crew members fatally injured | 37 | 40 | 44 | 15 | 29 | 25 | 26 | 20 | 34 | 11 | 18 |
| Commercial | 20 | 11 | 21 | 3 | 10 | 3 | 11 | 3 | 10 | 2 | 4 |
| Airliner (CARs 705) | 4 | 0 | 0 | 0 | 0 | 0 | 0 | 0 | 0 | 0 | 0 |
| Commuter (CARs 704) | 2 | 0 | 2 | 0 | 0 | 0 | 0 | 0 | 0 | 0 | 0 |
| Air taxi (CARs 703) | 7 | 7 | 14 | 1 | 4 | 1 | 1 | 0 | 8 | 1 | 0 |
| Aerial work (CARs 702) | 5 | 2 | 4 | 2 | 4 | 1 | 4 | 3 | 1 | 1 | 4 |
| Foreign air operator (CARs 701) | 0 | 0 | 0 | 0 | 0 | 0 | 0 | 0 | 0 | 0 | 0 |
| Flight training units (CARs 406) | 2 | 1 | 1 | 0 | 2 | 1 | 5 | 0 | 1 | 0 | 0 |
| Other commercial | 0 | 1 | 0 | 0 | 0 | 0 | 1 | 0 | 0 | 0 | 0 |
| Private | 16 | 25 | 21 | 12 | 20 | 22 | 15 | 17 | 24 | 9 | 14 |
| Private operators (CARs 604) | 2 | 0 | 1 | 0 | 0 | 1 | 0 | 1 | 0 | 0 | 0 |
| Recreational | 14 | 25 | 20 | 12 | 20 | 18 | 14 | 17 | 22 | 9 | 14 |
| Other private | 0 | 0 | 0 | 0 | 0 | 3 | 1 | 0 | 2 | 0 | 0 |
| State | 0 | 1 | 0 | 0 | 0 | 0 | 0 | 0 | 0 | 0 | 0 |
| Other/Unknown | 3 | 3 | 2 | 0 | 1 | 0 | 0 | 0 | 0 | 0 | 0 |
| Passengers fatally injured | 29 | 22 | 20 | 6 | 18 | 20 | 8 | 18 | 36 | 5 | 11 |
| Commercial | 20 | 6 | 8 | 1 | 10 | 3 | 4 | 6 | 15 | 0 | 3 |
| Airliner (CARs 705) | 8 | 0 | 0 | 0 | 0 | 0 | 1 | 0 | 0 | 0 | 0 |
| Commuter (CARs 704) | 0 | 1 | 3 | 0 | 0 | 0 | 0 | 0 | 0 | 0 | 0 |
| Air taxi (CARs 703) | 9 | 5 | 5 | 1 | 8 | 0 | 0 | 5 | 13 | 0 | 0 |
| Aerial work (CARs 702) | 3 | 0 | 0 | 0 | 2 | 1 | 3 | 1 | 2 | 0 | 3 |
| Foreign air operator (CARs 701) | 0 | 0 | 0 | 0 | 0 | 0 | 0 | 0 | 0 | 0 | 0 |
| Flight training units (CARs 406) | 0 | 0 | 0 | 0 | 0 | 2 | 0 | 0 | 0 | 0 | 0 |
| Other commercial | 0 | 0 | 0 | 0 | 0 | 0 | 0 | 0 | 0 | 0 | 0 |
| Private | 9 | 12 | 11 | 5 | 8 | 17 | 4 | 12 | 21 | 5 | 8 |
| Private operators (CARs 604) | 0 | 0 | 0 | 0 | 0 | 3 | 0 | 0 | 0 | 0 | 0 |
| Recreational | 9 | 12 | 11 | 5 | 8 | 9 | 3 | 12 | 21 | 5 | 8 |
| Other private | 0 | 0 | 0 | 0 | 0 | 5 | 1 | 0 | 0 | 0 | 0 |
| State | 0 | 0 | 0 | 0 | 0 | 0 | 0 | 0 | 0 | 0 | 0 |
| Other/Unknown | 0 | 4 | 1 | 0 | 0 | 0 | 0 | 0 | 0 | 0 | 0 |
| Persons on the ground fatally injured | 0 | 1 | 1 | 0 | 0 | 0 | 0 | 0 | 0 | 0 | 3 |
| Persons fatally injured | 66 | 63 | 65 | 21 | 47 | 45 | 34 | 38 | 70 | 16 | 32 |
| Airplane | 46 | 44 | 46 | 19 | 35 | 37 | 27 | 30 | 60 | 11 | 19 |
| Helicopter | 15 | 9 | 12 | 0 | 8 | 3 | 5 | 6 | 5 | 2 | 10 |
| Ultralight | 3 | 8 | 4 | 2 | 4 | 4 | 1 | 2 | 5 | 3 | 3 |
| Other aircraft type | 2 | 2 | 7 | 0 | 0 | 1 | 1 | 0 | 2 | 0 | 0 |
|
Data extracted 15 March 2022 |
|||||||||||
| 2011 | 2012 | 2013 | 2014 | 2015 | 2016 | 2017 | 2018 | 2019 | 2020 | 2021 | |
|---|---|---|---|---|---|---|---|---|---|---|---|
| Persons seriously injured | 49 | 48 | 22 | 35 | 31 | 18 | 33 | 28 | 31 | 18 | 44 |
| In Canada, involving Canadian-registered aircraft | 46 | 39 | 22 | 34 | 28 | 17 | 31 | 23 | 27 | 15 | 42 |
| Outside Canada, involving Canadian-registered Aircraft | 2 | 5 | 0 | 0 | 3 | 1 | 2 | 1 | 3 | 3 | 2 |
| In Canada, involving foreign-registered aircraft | 1 | 4 | 0 | 1 | 0 | 0 | 0 | 4 | 1 | 0 | 0 |
| Persons seriously injured | 49 | 48 | 22 | 35 | 31 | 18 | 33 | 28 | 31 | 18 | 44 |
| Commercial | 31 | 22 | 11 | 10 | 15 | 8 | 13 | 17 | 13 | 4 | 12 |
| Airliner (CARs 705) | 10 | 1 | 0 | 0 | 3 | 2 | 8 | 4 | 1 | 1 | 3 |
| Commuter (CARs 704) | 7 | 2 | 2 | 0 | 0 | 0 | 0 | 0 | 0 | 1 | 0 |
| Air taxi (CARs 703) | 9 | 15 | 6 | 5 | 8 | 4 | 0 | 9 | 8 | 0 | 1 |
| Aerial work (CARs 702) | 5 | 1 | 3 | 3 | 3 | 2 | 2 | 2 | 2 | 1 | 7 |
| Foreign air operator (CARs 701) | 0 | 1 | 0 | 0 | 0 | 0 | 0 | 1 | 0 | 0 | 0 |
| Flight training units (CARs 406) | 0 | 0 | 0 | 2 | 1 | 0 | 2 | 1 | 2 | 1 | 1 |
| Other commercial | 0 | 2 | 0 | 0 | 0 | 0 | 1 | 0 | 0 | 0 | 0 |
| Private | 18 | 26 | 10 | 23 | 16 | 10 | 20 | 11 | 18 | 13 | 32 |
| Private operators (CARs 604) | 0 | 0 | 0 | 0 | 0 | 0 | 0 | 0 | 0 | 0 | 0 |
| Recreational | 18 | 26 | 10 | 23 | 14 | 9 | 19 | 8 | 18 | 13 | 32 |
| Other private | 0 | 0 | 0 | 0 | 2 | 1 | 1 | 3 | 0 | 0 | 0 |
| State | 0 | 0 | 0 | 0 | 0 | 0 | 0 | 0 | 0 | 1 | 0 |
| Other/Unknown | 0 | 0 | 1 | 2 | 0 | 0 | 0 | 0 | 0 | 0 | 0 |
| Crew members seriously injured | 18 | 24 | 13 | 23 | 17 | 8 | 22 | 19 | 16 | 13 | 30 |
| Commercial | 6 | 6 | 4 | 5 | 6 | 3 | 8 | 10 | 2 | 3 | 11 |
| Airliner (CARs 705) | 0 | 0 | 0 | 0 | 1 | 0 | 3 | 3 | 0 | 1 | 3 |
| Commuter (CARs 704) | 0 | 2 | 0 | 0 | 0 | 0 | 0 | 0 | 0 | 0 | 0 |
| Air taxi (CARs 703) | 2 | 1 | 2 | 2 | 2 | 2 | 0 | 3 | 0 | 0 | 0 |
| Aerial work (CARs 702) | 4 | 1 | 2 | 1 | 3 | 1 | 2 | 2 | 1 | 1 | 7 |
| Foreign air operator (CARs 701) | 0 | 1 | 0 | 0 | 0 | 0 | 0 | 1 | 0 | 0 | 0 |
| Flight training units (CARs 406) | 0 | 0 | 0 | 2 | 0 | 0 | 2 | 1 | 1 | 1 | 1 |
| Other commercial | 0 | 1 | 0 | 0 | 0 | 0 | 1 | 0 | 0 | 0 | 0 |
| Private | 12 | 18 | 8 | 17 | 11 | 5 | 14 | 9 | 14 | 9 | 19 |
| Private operators (CARs 604) | 0 | 0 | 0 | 0 | 0 | 0 | 0 | 0 | 0 | 0 | 0 |
| Recreational | 12 | 18 | 8 | 17 | 9 | 5 | 14 | 7 | 14 | 9 | 19 |
| Other private | 0 | 0 | 0 | 0 | 2 | 0 | 0 | 2 | 0 | 0 | 0 |
| State | 0 | 0 | 0 | 0 | 0 | 0 | 0 | 0 | 0 | 1 | 0 |
| Other/Unknown | 0 | 0 | 1 | 1 | 0 | 0 | 0 | 0 | 0 | 0 | 0 |
| Passengers seriously injured | 30 | 23 | 8 | 11 | 14 | 8 | 11 | 9 | 13 | 4 | 13 |
| Commercial | 24 | 15 | 6 | 5 | 9 | 4 | 5 | 7 | 9 | 1 | 1 |
| Airliner (CARs 705) | 10 | 0 | 0 | 0 | 2 | 2 | 5 | 1 | 0 | 0 | 0 |
| Commuter (CARs 704) | 7 | 0 | 2 | 0 | 0 | 0 | 0 | 0 | 0 | 1 | 0 |
| Air taxi (CARs 703) | 7 | 14 | 4 | 3 | 6 | 2 | 0 | 6 | 7 | 0 | 1 |
| Aerial work (CARs 702) | 0 | 0 | 0 | 2 | 0 | 0 | 0 | 0 | 1 | 0 | 0 |
| Foreign air operator (CARs 701) | 0 | 0 | 0 | 0 | 0 | 0 | 0 | 0 | 0 | 0 | 0 |
| Flight training units (CARs 406) | 0 | 0 | 0 | 0 | 1 | 0 | 0 | 0 | 1 | 0 | 0 |
| Other commercial | 0 | 1 | 0 | 0 | 0 | 0 | 0 | 0 | 0 | 0 | 0 |
| Private | 6 | 8 | 2 | 5 | 5 | 4 | 6 | 2 | 4 | 3 | 12 |
| Private operators (CARs 604) | 0 | 0 | 0 | 0 | 0 | 0 | 0 | 0 | 0 | 0 | 0 |
| Recreational | 6 | 8 | 2 | 5 | 5 | 4 | 5 | 1 | 4 | 3 | 12 |
| Other private | 0 | 0 | 0 | 0 | 0 | 0 | 1 | 1 | 0 | 0 | 0 |
| State | 0 | 0 | 0 | 0 | 0 | 0 | 0 | 0 | 0 | 0 | 0 |
| Other/Unknown | 0 | 0 | 0 | 1 | 0 | 0 | 0 | 0 | 0 | 0 | 0 |
| Persons on the ground seriously injured | 1 | 1 | 1 | 1 | 0 | 2 | 0 | 0 | 2 | 1 | 1 |
| Persons seriously injured | 49 | 48 | 22 | 35 | 31 | 18 | 33 | 28 | 31 | 18 | 44 |
| Airplane | 36 | 31 | 13 | 21 | 23 | 10 | 23 | 23 | 26 | 10 | 26 |
| Helicopter | 8 | 7 | 6 | 6 | 5 | 6 | 3 | 2 | 1 | 3 | 7 |
| Ultralight | 5 | 6 | 3 | 7 | 3 | 1 | 6 | 3 | 4 | 4 | 8 |
| Other aircraft type | 0 | 4 | 0 | 1 | 0 | 1 | 1 | 0 | 0 | 1 | 3 |
|
Data extracted 15 March 2022 |
|||||||||||
| 2011 | 2012 | 2013 | 2014 | 2015 | 2016 | 2017 | 2018 | 2019 | 2020 | 2021 | |
|---|---|---|---|---|---|---|---|---|---|---|---|
| Airplane accidents | 192 | 191 | 204 | 170 | 190 | 167 | 171 | 143 | 168 | 133 | 136 |
| Training | 28 | 27 | 24 | 27 | 16 | 20 | 31 | 14 | 28 | 23 | 17 |
| Pleasure/Travel | 102 | 109 | 127 | 96 | 125 | 112 | 92 | 83 | 83 | 74 | 85 |
| Business | 7 | 4 | 2 | 9 | 1 | 3 | 1 | 7 | 5 | 4 | 4 |
| Forest fire management | 1 | 2 | 3 | 2 | 2 | 1 | 0 | 1 | 2 | 1 | 4 |
| Test/Demonstration/Ferry | 4 | 4 | 4 | 5 | 2 | 2 | 4 | 1 | 3 | 2 | 3 |
| Aerial application | 4 | 3 | 7 | 4 | 5 | 6 | 6 | 5 | 6 | 8 | 1 |
| Inspection | 0 | 1 | 1 | 0 | 1 | 0 | 1 | 0 | 0 | 0 | 0 |
| Air transport | 35 | 28 | 26 | 22 | 22 | 16 | 27 | 26 | 29 | 15 | 14 |
| Air ambulance | 1 | 1 | 0 | 1 | 0 | 3 | 1 | 1 | 1 | 1 | 2 |
| Sightseeing | 2 | 6 | 1 | 1 | 1 | 0 | 1 | 1 | 2 | 0 | 1 |
| Other/Unknown | 10 | 8 | 11 | 4 | 16 | 5 | 8 | 6 | 9 | 5 | 5 |
| Fatal airplane accidents | 21 | 25 | 24 | 10 | 18 | 21 | 18 | 17 | 23 | 7 | 14 |
| Training | 1 | 1 | 2 | 1 | 1 | 1 | 3 | 0 | 1 | 1 | 0 |
| Pleasure/Travel | 10 | 16 | 11 | 7 | 12 | 15 | 9 | 12 | 12 | 5 | 10 |
| Business | 0 | 1 | 1 | 1 | 0 | 1 | 0 | 1 | 1 | 0 | 1 |
| Forest fire management | 0 | 0 | 0 | 0 | 1 | 0 | 0 | 0 | 0 | 0 | 1 |
| Test/Demonstration/Ferry | 0 | 1 | 1 | 0 | 0 | 1 | 0 | 0 | 1 | 0 | 0 |
| Aerial application | 0 | 0 | 1 | 0 | 0 | 2 | 1 | 1 | 0 | 0 | 0 |
| Inspection | 0 | 0 | 0 | 0 | 0 | 0 | 0 | 0 | 0 | 0 | 0 |
| Air transport | 8 | 4 | 5 | 1 | 2 | 1 | 2 | 2 | 6 | 1 | 0 |
| Air ambulance | 0 | 0 | 0 | 0 | 0 | 0 | 0 | 0 | 0 | 0 | 0 |
| Sightseeing | 1 | 0 | 0 | 0 | 1 | 0 | 0 | 0 | 0 | 0 | 0 |
| Other/Unknown | 1 | 3 | 3 | 0 | 2 | 0 | 3 | 2 | 2 | 0 | 2 |
| Helicopter accidents | 35 | 41 | 27 | 34 | 32 | 27 | 27 | 26 | 27 | 16 | 28 |
| Training | 2 | 1 | 1 | 2 | 5 | 1 | 7 | 1 | 2 | 0 | 1 |
| Pleasure/Travel | 9 | 8 | 2 | 7 | 8 | 9 | 4 | 6 | 9 | 6 | 6 |
| Business | 0 | 3 | 1 | 0 | 1 | 0 | 0 | 2 | 1 | 0 | 1 |
| Forest fire management | 2 | 1 | 3 | 0 | 2 | 0 | 2 | 2 | 1 | 1 | 3 |
| Test/Demonstration/Ferry | 1 | 0 | 1 | 0 | 0 | 0 | 0 | 1 | 0 | 0 | 2 |
| Aerial application | 1 | 5 | 0 | 1 | 2 | 1 | 3 | 1 | 3 | 2 | 1 |
| Inspection | 2 | 2 | 2 | 3 | 0 | 1 | 0 | 1 | 0 | 0 | 0 |
| Air transport | 13 | 9 | 8 | 18 | 10 | 7 | 3 | 3 | 9 | 2 | 6 |
| Air ambulance | 0 | 1 | 2 | 0 | 0 | 0 | 1 | 0 | 0 | 0 | 0 |
| Sightseeing | 0 | 1 | 0 | 1 | 0 | 0 | 1 | 1 | 0 | 0 | 0 |
| Other/Unknown | 5 | 10 | 7 | 2 | 4 | 8 | 6 | 8 | 2 | 5 | 8 |
| Fatal helicopter accidents | 8 | 7 | 6 | 0 | 5 | 2 | 2 | 4 | 3 | 2 | 5 |
| Training | 1 | 1 | 0 | 0 | 0 | 0 | 1 | 0 | 0 | 0 | 0 |
| Pleasure/Travel | 2 | 0 | 0 | 0 | 0 | 1 | 0 | 2 | 2 | 1 | 1 |
| Business | 0 | 1 | 0 | 0 | 1 | 0 | 0 | 0 | 0 | 0 | 0 |
| Forest fire management | 1 | 0 | 0 | 0 | 0 | 0 | 0 | 0 | 0 | 0 | 1 |
| Test/Demonstration/Ferry | 1 | 0 | 0 | 0 | 0 | 0 | 0 | 1 | 0 | 0 | 0 |
| Aerial application | 0 | 0 | 0 | 0 | 1 | 0 | 0 | 0 | 0 | 0 | 0 |
| Inspection | 1 | 0 | 1 | 0 | 0 | 0 | 0 | 0 | 0 | 0 | 0 |
| Air transport | 1 | 1 | 3 | 0 | 3 | 0 | 0 | 0 | 1 | 0 | 1 |
| Air ambulance | 0 | 0 | 1 | 0 | 0 | 0 | 0 | 0 | 0 | 0 | 0 |
| Sightseeing | 0 | 1 | 0 | 0 | 0 | 0 | 0 | 0 | 0 | 0 | 0 |
| Other/Unknown | 1 | 3 | 1 | 0 | 0 | 1 | 1 | 1 | 0 | 1 | 2 |
|
Data extracted 15 March 2022 1 Canadian-registered aircraft, excluding ultralights, balloons, gyroplanes, gliders, airships, hang gliders and similar aircraft types. 2 Breakdowns may not add up to totals. For example, when an occurrence involves a business airplane and a training airplane, the occurrence is counted in each type, but only once in the total. |
|||||||||||
| 2011 | 2012 | 2013 | 2014 | 2015 | 2016 | 2017 | 2018 | 2019 | 2020 | 2021 | |
|---|---|---|---|---|---|---|---|---|---|---|---|
| Accidents | 257 | 291 | 276 | 249 | 251 | 230 | 240 | 201 | 227 | 170 | 190 |
| Newfoundland and Labrador | 3 | 5 | 3 | 5 | 6 | 5 | 4 | 4 | 3 | 2 | 4 |
| Prince Edward Island | 0 | 0 | 0 | 0 | 0 | 0 | 2 | 0 | 0 | 0 | 0 |
| Nova Scotia | 5 | 5 | 5 | 3 | 6 | 2 | 3 | 2 | 1 | 1 | 2 |
| New Brunswick | 3 | 3 | 2 | 6 | 2 | 5 | 7 | 1 | 8 | 2 | 2 |
| Quebec | 58 | 71 | 66 | 69 | 51 | 34 | 44 | 31 | 50 | 33 | 45 |
| Ontario | 63 | 67 | 72 | 67 | 74 | 50 | 62 | 53 | 53 | 39 | 35 |
| Manitoba | 17 | 18 | 13 | 12 | 14 | 17 | 10 | 7 | 17 | 9 | 6 |
| Saskatchewan | 18 | 9 | 19 | 12 | 13 | 10 | 13 | 13 | 12 | 17 | 8 |
| Alberta | 22 | 35 | 29 | 33 | 23 | 38 | 35 | 32 | 29 | 25 | 29 |
| British Columbia | 43 | 54 | 51 | 30 | 42 | 53 | 39 | 36 | 38 | 34 | 45 |
| Yukon | 8 | 8 | 4 | 4 | 6 | 2 | 4 | 4 | 3 | 0 | 3 |
| Northwest Territories | 6 | 5 | 3 | 3 | 2 | 3 | 2 | 5 | 4 | 1 | 2 |
| Nunavut | 4 | 3 | 4 | 1 | 2 | 3 | 3 | 1 | 1 | 2 | 3 |
| Other airspace under Canadian air traffic control | 1 | 0 | 1 | 0 | 0 | 0 | 1 | 1 | 0 | 0 | 0 |
| Outside Canada | 6 | 8 | 4 | 4 | 10 | 8 | 11 | 11 | 8 | 5 | 6 |
| Fatal accidents | 35 | 42 | 38 | 14 | 29 | 29 | 22 | 23 | 33 | 12 | 22 |
| Newfoundland and Labrador | 0 | 0 | 0 | 0 | 1 | 0 | 0 | 0 | 2 | 1 | 1 |
| Prince Edward Island | 0 | 0 | 0 | 0 | 0 | 0 | 0 | 0 | 0 | 0 | 0 |
| Nova Scotia | 1 | 0 | 1 | 1 | 1 | 0 | 0 | 0 | 0 | 0 | 0 |
| New Brunswick | 0 | 0 | 0 | 1 | 0 | 1 | 0 | 0 | 1 | 0 | 0 |
| Quebec | 5 | 10 | 5 | 2 | 7 | 7 | 4 | 2 | 9 | 4 | 6 |
| Ontario | 6 | 10 | 9 | 5 | 6 | 5 | 4 | 6 | 6 | 1 | 5 |
| Manitoba | 1 | 3 | 2 | 0 | 1 | 1 | 3 | 0 | 1 | 0 | 0 |
| Saskatchewan | 3 | 1 | 2 | 1 | 2 | 2 | 2 | 1 | 0 | 0 | 0 |
| Alberta | 4 | 6 | 4 | 1 | 3 | 4 | 3 | 5 | 5 | 3 | 4 |
| British Columbia | 10 | 9 | 10 | 2 | 4 | 8 | 3 | 4 | 5 | 3 | 2 |
| Yukon | 1 | 1 | 0 | 0 | 0 | 0 | 1 | 0 | 2 | 0 | 0 |
| Northwest Territories | 2 | 0 | 1 | 0 | 0 | 0 | 0 | 1 | 1 | 0 | 0 |
| Nunavut | 1 | 1 | 0 | 0 | 0 | 0 | 0 | 0 | 0 | 0 | 2 |
| Other airspace under Canadian air traffic control | 0 | 0 | 1 | 0 | 0 | 0 | 0 | 0 | 0 | 0 | 0 |
| Outside Canada | 1 | 1 | 3 | 1 | 4 | 1 | 2 | 4 | 1 | 0 | 2 |
| Persons fatally injured | 66 | 63 | 65 | 21 | 47 | 45 | 34 | 38 | 70 | 16 | 32 |
| Newfoundland and Labrador | 0 | 0 | 0 | 0 | 1 | 0 | 0 | 0 | 8 | 1 | 2 |
| Prince Edward Island | 0 | 0 | 0 | 0 | 0 | 0 | 0 | 0 | 0 | 0 | 0 |
| Nova Scotia | 1 | 0 | 1 | 1 | 1 | 0 | 0 | 0 | 0 | 0 | 0 |
| New Brunswick | 0 | 0 | 0 | 2 | 0 | 2 | 0 | 0 | 1 | 0 | 0 |
| Quebec | 9 | 11 | 5 | 2 | 16 | 15 | 6 | 4 | 14 | 5 | 7 |
| Ontario | 9 | 19 | 19 | 8 | 10 | 5 | 9 | 8 | 16 | 1 | 6 |
| Manitoba | 1 | 4 | 5 | 0 | 1 | 2 | 4 | 0 | 3 | 0 | 0 |
| Saskatchewan | 7 | 5 | 3 | 2 | 3 | 2 | 3 | 1 | 0 | 0 | 0 |
| Alberta | 5 | 6 | 5 | 1 | 4 | 4 | 5 | 6 | 8 | 6 | 8 |
| British Columbia | 16 | 15 | 17 | 3 | 7 | 12 | 4 | 6 | 12 | 3 | 3 |
| Yukon | 1 | 1 | 0 | 0 | 0 | 0 | 1 | 0 | 4 | 0 | 0 |
| Northwest Territories | 4 | 0 | 1 | 0 | 0 | 0 | 0 | 3 | 2 | 0 | 0 |
| Nunavut | 12 | 1 | 0 | 0 | 0 | 0 | 0 | 0 | 0 | 0 | 4 |
| Other airspace under Canadian air traffic control | 0 | 0 | 3 | 0 | 0 | 0 | 0 | 0 | 0 | 0 | 0 |
| Outside Canada | 1 | 1 | 6 | 2 | 4 | 3 | 2 | 10 | 2 | 0 | 2 |
|
Data extracted 15 March 2022 |
|||||||||||
| 2011 | 2012 | 2013 | 2014 | 2015 | 2016 | 2017 | 2018 | 2019 | 2020 | 2021 | |
|---|---|---|---|---|---|---|---|---|---|---|---|
| Accidents | 230 | 239 | 243 | 212 | 227 | 200 | 208 | 173 | 200 | 153 | 169 |
| Newfoundland and Labrador | 3 | 5 | 3 | 4 | 6 | 4 | 3 | 2 | 2 | 2 | 3 |
| Prince Edward Island | 0 | 0 | 0 | 0 | 0 | 0 | 1 | 0 | 0 | 0 | 0 |
| Nova Scotia | 3 | 3 | 5 | 2 | 5 | 2 | 2 | 1 | 1 | 1 | 2 |
| New Brunswick | 3 | 3 | 2 | 6 | 2 | 5 | 5 | 1 | 8 | 2 | 2 |
| Quebec | 52 | 52 | 57 | 57 | 44 | 28 | 39 | 28 | 41 | 29 | 40 |
| Ontario | 56 | 54 | 59 | 53 | 66 | 43 | 51 | 44 | 46 | 32 | 27 |
| Manitoba | 16 | 15 | 13 | 11 | 13 | 17 | 10 | 7 | 12 | 9 | 6 |
| Saskatchewan | 17 | 8 | 18 | 10 | 12 | 10 | 12 | 13 | 12 | 16 | 8 |
| Alberta | 18 | 30 | 27 | 31 | 21 | 36 | 30 | 27 | 27 | 23 | 27 |
| British Columbia | 39 | 46 | 44 | 27 | 39 | 43 | 35 | 30 | 36 | 32 | 41 |
| Yukon | 7 | 7 | 4 | 4 | 6 | 1 | 4 | 2 | 2 | 0 | 2 |
| Northwest Territories | 6 | 5 | 3 | 2 | 2 | 3 | 2 | 5 | 4 | 1 | 2 |
| Nunavut | 3 | 3 | 3 | 1 | 1 | 2 | 3 | 1 | 1 | 2 | 3 |
| Other airspace under Canadian air traffic control | 1 | 0 | 1 | 0 | 0 | 0 | 0 | 1 | 0 | 0 | 0 |
| Outside Canada | 6 | 8 | 4 | 4 | 10 | 6 | 11 | 11 | 8 | 4 | 6 |
| Fatal accidents | 30 | 33 | 32 | 10 | 23 | 24 | 21 | 21 | 26 | 9 | 19 |
| Newfoundland and Labrador | 0 | 0 | 0 | 0 | 1 | 0 | 0 | 0 | 1 | 1 | 1 |
| Prince Edward Island | 0 | 0 | 0 | 0 | 0 | 0 | 0 | 0 | 0 | 0 | 0 |
| Nova Scotia | 0 | 0 | 1 | 0 | 0 | 0 | 0 | 0 | 0 | 0 | 0 |
| New Brunswick | 0 | 0 | 0 | 1 | 0 | 1 | 0 | 0 | 1 | 0 | 0 |
| Quebec | 5 | 4 | 3 | 1 | 6 | 5 | 4 | 2 | 5 | 3 | 5 |
| Ontario | 4 | 9 | 6 | 3 | 5 | 3 | 4 | 5 | 5 | 0 | 3 |
| Manitoba | 1 | 3 | 2 | 0 | 0 | 1 | 3 | 0 | 1 | 0 | 0 |
| Saskatchewan | 3 | 1 | 2 | 1 | 2 | 2 | 2 | 1 | 0 | 0 | 0 |
| Alberta | 3 | 5 | 4 | 1 | 3 | 4 | 3 | 4 | 5 | 2 | 4 |
| British Columbia | 9 | 8 | 9 | 2 | 2 | 7 | 2 | 4 | 5 | 3 | 2 |
| Yukon | 1 | 1 | 0 | 0 | 0 | 0 | 1 | 0 | 1 | 0 | 0 |
| Northwest Territories | 2 | 0 | 1 | 0 | 0 | 0 | 0 | 1 | 1 | 0 | 0 |
| Nunavut | 1 | 1 | 0 | 0 | 0 | 0 | 0 | 0 | 0 | 0 | 2 |
| Other airspace under Canadian air traffic control | 0 | 0 | 1 | 0 | 0 | 0 | 0 | 0 | 0 | 0 | 0 |
| Outside Canada | 1 | 1 | 3 | 1 | 4 | 1 | 2 | 4 | 1 | 0 | 2 |
| Persons fatally injured | 61 | 54 | 59 | 15 | 40 | 34 | 33 | 36 | 54 | 13 | 29 |
| Newfoundland and Labrador | 0 | 0 | 0 | 0 | 1 | 0 | 0 | 0 | 7 | 1 | 2 |
| Prince Edward Island | 0 | 0 | 0 | 0 | 0 | 0 | 0 | 0 | 0 | 0 | 0 |
| Nova Scotia | 0 | 0 | 1 | 0 | 0 | 0 | 0 | 0 | 0 | 0 | 0 |
| New Brunswick | 0 | 0 | 0 | 2 | 0 | 2 | 0 | 0 | 1 | 0 | 0 |
| Quebec | 9 | 5 | 3 | 1 | 15 | 7 | 6 | 4 | 8 | 4 | 6 |
| Ontario | 7 | 18 | 16 | 4 | 9 | 3 | 9 | 7 | 9 | 0 | 4 |
| Manitoba | 1 | 4 | 5 | 0 | 0 | 2 | 4 | 0 | 3 | 0 | 0 |
| Saskatchewan | 7 | 5 | 3 | 2 | 3 | 2 | 3 | 1 | 0 | 0 | 0 |
| Alberta | 4 | 5 | 5 | 1 | 4 | 4 | 5 | 5 | 8 | 5 | 8 |
| British Columbia | 15 | 14 | 16 | 3 | 4 | 11 | 3 | 6 | 12 | 3 | 3 |
| Yukon | 1 | 1 | 0 | 0 | 0 | 0 | 1 | 0 | 2 | 0 | 0 |
| Northwest Territories | 4 | 0 | 1 | 0 | 0 | 0 | 0 | 3 | 2 | 0 | 0 |
| Nunavut | 12 | 1 | 0 | 0 | 0 | 0 | 0 | 0 | 0 | 0 | 4 |
| Other airspace under Canadian air traffic control | 0 | 0 | 3 | 0 | 0 | 0 | 0 | 0 | 0 | 0 | 0 |
| Outside Canada | 1 | 1 | 6 | 2 | 4 | 3 | 2 | 10 | 2 | 0 | 2 |
|
Data extracted 15 March 2022 1 Canadian-registered aircraft, excluding ultralights, balloons, gyroplanes, gliders, airships, hang gliders and similar aircraft types. |
|||||||||||
| 2011 | 2012 | 2013 | 2014 | 2015 | 2016 | 2017 | 2018 | 2019 | 2020 | 2021 | |
|---|---|---|---|---|---|---|---|---|---|---|---|
| Incidents1 | 673 | 645 | 689 | 741 | 789 | 833 | 939 | 860 | 915 | 421 | 499 |
| Risk of collision / Loss of separation | 120 | 102 | 115 | 94 | 111 | 139 | 172 | 141 | 138 | 48 | 62 |
| Declared emergency | 275 | 266 | 294 | 313 | 333 | 311 | 348 | 340 | 366 | 190 | 205 |
| Engine failure | 95 | 92 | 83 | 104 | 110 | 110 | 98 | 91 | 103 | 50 | 83 |
| Smoke/Fire | 88 | 71 | 67 | 89 | 87 | 85 | 100 | 99 | 91 | 25 | 44 |
| Collision | 7 | 5 | 15 | 16 | 8 | 18 | 24 | 26 | 31 | 8 | 6 |
| Control difficulties | 31 | 33 | 25 | 40 | 29 | 35 | 34 | 41 | 25 | 25 | 24 |
| Crew unable to perform duties | 26 | 40 | 58 | 37 | 46 | 66 | 78 | 57 | 87 | 34 | 16 |
| Dangerous goods-related | 0 | 1 | 3 | 4 | 0 | 2 | 0 | 2 | 0 | 0 | 3 |
| Depressurization | 16 | 15 | 14 | 12 | 16 | 14 | 21 | 13 | 23 | 5 | 16 |
| Fuel shortage | 6 | 7 | 2 | 6 | 17 | 15 | 17 | 10 | 5 | 3 | 3 |
| Failure to remain in landing area | 7 | 10 | 9 | 20 | 17 | 19 | 22 | 11 | 9 | 10 | 10 |
| Incorrect fuel | 0 | 0 | 0 | 0 | 0 | 1 | 3 | 0 | 3 | 4 | 3 |
| Slung load released | 1 | 1 | 4 | 5 | 14 | 15 | 21 | 23 | 28 | 11 | 17 |
| Transmission or gearbox failure | 1 | 2 | 0 | 1 | 1 | 3 | 1 | 0 | 1 | 0 | 0 |
| Incidents1,2 | 673 | 645 | 689 | 741 | 789 | 833 | 939 | 860 | 915 | 421 | 499 |
| Commercial | 637 | 609 | 656 | 699 | 741 | 785 | 888 | 815 | 869 | 393 | 461 |
| Airliner (CARs 705) | 446 | 409 | 450 | 429 | 437 | 490 | 614 | 547 | 572 | 220 | 246 |
| Commuter (CARs 704) | 76 | 83 | 95 | 106 | 87 | 79 | 73 | 60 | 67 | 50 | 51 |
| Air taxi (CARs 703) | 28 | 22 | 30 | 79 | 114 | 104 | 102 | 90 | 104 | 59 | 83 |
| Aerial work (CARs 702) | 15 | 11 | 12 | 34 | 48 | 43 | 55 | 55 | 59 | 35 | 56 |
| Foreign air operator (CARs 701) | 109 | 117 | 113 | 82 | 75 | 94 | 80 | 91 | 86 | 32 | 27 |
| Flight training units (CARs 406) | 4 | 3 | 4 | 5 | 6 | 12 | 11 | 7 | 13 | 7 | 8 |
| Other commercial | 2 | 1 | 1 | 0 | 2 | 5 | 1 | 2 | 4 | 2 | 2 |
| Private | 39 | 35 | 31 | 37 | 52 | 45 | 56 | 51 | 56 | 27 | 37 |
| Private operators (CARs 604) | 19 | 20 | 18 | 22 | 19 | 19 | 32 | 19 | 25 | 12 | 17 |
| Recreational | 20 | 15 | 13 | 14 | 15 | 14 | 11 | 9 | 10 | 6 | 15 |
| Other private | 1 | 0 | 0 | 1 | 18 | 12 | 13 | 23 | 22 | 10 | 6 |
| State | 13 | 20 | 20 | 13 | 15 | 8 | 15 | 11 | 8 | 5 | 7 |
| Other/Unknown | 5 | 4 | 4 | 12 | 15 | 22 | 13 | 12 | 12 | 2 | 3 |
| Incidents1,2 | 673 | 645 | 689 | 741 | 789 | 833 | 939 | 860 | 915 | 421 | 499 |
| Airplane | 655 | 633 | 673 | 715 | 749 | 795 | 892 | 819 | 842 | 400 | 457 |
| Helicopter | 20 | 17 | 20 | 30 | 47 | 38 | 52 | 43 | 77 | 21 | 41 |
| Ultralight/Other aircraft type3 | 0 | 0 | 0 | 3 | 8 | 7 | 4 | 4 | 6 | 0 | 1 |
| Aircraft involved in incidents1,4 | 776 | 742 | 800 | 830 | 887 | 957 | 1063 | 970 | 1016 | 452 | 532 |
| Airplanes | 756 | 725 | 780 | 797 | 832 | 912 | 1006 | 921 | 931 | 431 | 490 |
| Helicopters | 20 | 17 | 20 | 30 | 47 | 38 | 53 | 45 | 79 | 21 | 41 |
| Ultralight / Other aircraft type3 | 0 | 0 | 0 | 3 | 8 | 7 | 4 | 4 | 6 | 0 | 1 |
| Incidents1 | 673 | 645 | 689 | 741 | 789 | 833 | 939 | 860 | 915 | 421 | 499 |
| Newfoundland and Labrador | 14 | 17 | 29 | 22 | 30 | 31 | 27 | 35 | 29 | 11 | 16 |
| Prince Edward Island | 1 | 0 | 2 | 0 | 1 | 4 | 1 | 2 | 1 | 1 | 1 |
| Nova Scotia | 19 | 17 | 11 | 22 | 19 | 17 | 22 | 28 | 28 | 13 | 6 |
| New Brunswick | 7 | 7 | 7 | 8 | 9 | 9 | 4 | 7 | 11 | 3 | 6 |
| Quebec | 126 | 107 | 122 | 89 | 116 | 109 | 139 | 141 | 147 | 75 | 76 |
| Ontario | 174 | 155 | 166 | 157 | 152 | 166 | 230 | 144 | 166 | 89 | 115 |
| Manitoba | 31 | 31 | 31 | 51 | 54 | 47 | 49 | 43 | 44 | 26 | 42 |
| Saskatchewan | 11 | 18 | 27 | 32 | 21 | 25 | 19 | 16 | 24 | 15 | 19 |
| Alberta | 82 | 81 | 103 | 98 | 117 | 110 | 107 | 104 | 106 | 43 | 40 |
| British Columbia | 76 | 101 | 99 | 132 | 154 | 137 | 101 | 123 | 129 | 56 | 74 |
| Yukon | 3 | 4 | 5 | 6 | 6 | 5 | 5 | 2 | 8 | 1 | 6 |
| Northwest Territories | 30 | 17 | 16 | 25 | 17 | 9 | 20 | 22 | 9 | 11 | 12 |
| Nunavut | 19 | 19 | 10 | 20 | 15 | 15 | 15 | 19 | 15 | 4 | 11 |
| Other airspace under Canadian air traffic control | 27 | 23 | 23 | 24 | 20 | 32 | 19 | 14 | 17 | 7 | 3 |
| Outside Canada | 54 | 48 | 38 | 55 | 58 | 117 | 181 | 161 | 181 | 66 | 72 |
|
Data extracted 15 March 2022 1 Under the 2014 TSB Regulations, reportable aviation incidents include a) aircraft having a maximum certificated take-off weight greater than 2250 kg (formerly 5700 kg); b) aircraft being operated under an air operator certificate issued under the Canadian Aviation Regulations, Part VII. 2 Breakdowns may not add up to totals. For example, when an occurrence involves an airplane and a helicopter, the occurrence is counted in each type, but only once in the total. 3 Includes balloons, gyroplanes, gliders, airships, hang gliders, remotely piloted aircraft systems (RPAS) and similar aircraft types. 4 "Aircraft involved in accidents" are aircraft counts; all other data are accident counts. |
|||||||||||
| 2011 | 2012 | 2013 | 2014 | 2015 | 2016 | 2017 | 2018 | 2019 | 2020 | 2021 | |
|---|---|---|---|---|---|---|---|---|---|---|---|
| Incidents1 | 573 | 530 | 579 | 654 | 711 | 737 | 866 | 769 | 835 | 385 | 472 |
| Risk of collision / Loss of separation | 106 | 92 | 105 | 84 | 101 | 127 | 159 | 134 | 128 | 47 | 61 |
| Declared emergency | 224 | 200 | 231 | 277 | 290 | 263 | 316 | 298 | 318 | 170 | 192 |
| Engine failure | 87 | 77 | 70 | 94 | 102 | 102 | 88 | 79 | 96 | 44 | 78 |
| Smoke/Fire | 67 | 59 | 55 | 76 | 79 | 75 | 95 | 85 | 83 | 21 | 41 |
| Collision | 7 | 4 | 14 | 15 | 7 | 16 | 23 | 21 | 27 | 8 | 6 |
| Control difficulties | 27 | 31 | 22 | 36 | 28 | 30 | 33 | 40 | 25 | 24 | 24 |
| Crew unable to perform duties | 26 | 38 | 56 | 35 | 44 | 65 | 74 | 55 | 86 | 30 | 15 |
| Dangerous goods-related | 0 | 1 | 3 | 3 | 0 | 2 | 0 | 2 | 0 | 0 | 2 |
| Depressurization | 15 | 13 | 10 | 10 | 14 | 13 | 19 | 11 | 23 | 5 | 15 |
| Fuel shortage | 5 | 4 | 2 | 3 | 15 | 11 | 16 | 5 | 4 | 3 | 3 |
| Failure to remain in landing area | 7 | 9 | 7 | 17 | 17 | 14 | 18 | 10 | 8 | 10 | 10 |
| Incorrect fuel | 0 | 0 | 0 | 0 | 0 | 1 | 3 | 0 | 3 | 4 | 3 |
| Slung load released | 1 | 1 | 4 | 4 | 13 | 15 | 21 | 23 | 28 | 11 | 17 |
| Transmission or gearbox failure | 1 | 1 | 0 | 0 | 1 | 3 | 1 | 0 | 1 | 0 | 0 |
| Incidents by operator type1,2 | 573 | 530 | 579 | 654 | 711 | 737 | 866 | 769 | 835 | 385 | 472 |
| Commercial | 547 | 504 | 552 | 622 | 674 | 705 | 825 | 741 | 799 | 363 | 437 |
| Airliner (CARs 705) | 443 | 409 | 449 | 427 | 436 | 489 | 613 | 546 | 571 | 218 | 246 |
| Commuter (CARs 704) | 76 | 83 | 95 | 106 | 87 | 79 | 73 | 60 | 67 | 50 | 51 |
| Air taxi (CARs 703) | 28 | 21 | 30 | 79 | 114 | 104 | 102 | 90 | 104 | 58 | 83 |
| Aerial work (CARs 702) | 15 | 11 | 12 | 31 | 47 | 43 | 55 | 55 | 59 | 35 | 56 |
| Flight training units (CARs 406) | 4 | 3 | 4 | 5 | 6 | 12 | 11 | 7 | 13 | 7 | 8 |
| Other commercial | 0 | 0 | 0 | 0 | 1 | 2 | 0 | 1 | 3 | 1 | 2 |
| Private | 29 | 28 | 25 | 29 | 40 | 37 | 48 | 33 | 45 | 22 | 34 |
| Private operators (CARs 604) | 11 | 14 | 13 | 17 | 16 | 19 | 32 | 19 | 24 | 12 | 17 |
| Recreational | 18 | 14 | 12 | 11 | 14 | 12 | 11 | 8 | 10 | 6 | 14 |
| Other private | 1 | 0 | 0 | 1 | 10 | 6 | 5 | 6 | 12 | 5 | 4 |
| State | 13 | 17 | 19 | 11 | 15 | 6 | 13 | 10 | 8 | 5 | 7 |
| Other/Unknown | 3 | 2 | 4 | 9 | 14 | 14 | 10 | 12 | 10 | 1 | 3 |
| Incidents1,2 | 573 | 530 | 579 | 654 | 711 | 737 | 866 | 769 | 835 | 385 | 472 |
| Airplane | 555 | 519 | 563 | 631 | 672 | 699 | 819 | 728 | 762 | 364 | 431 |
| Helicopter | 20 | 16 | 20 | 27 | 46 | 38 | 52 | 43 | 77 | 21 | 41 |
| Ultralight / Other aircraft type3 | 0 | 0 | 0 | 3 | 8 | 6 | 4 | 4 | 6 | 0 | 0 |
| Aircraft involved in incidents1,4 | 667 | 619 | 681 | 730 | 800 | 843 | 981 | 874 | 927 | 415 | 504 |
| Airplanes | 647 | 603 | 661 | 700 | 746 | 799 | 924 | 825 | 842 | 394 | 463 |
| Helicopters | 20 | 16 | 20 | 27 | 46 | 38 | 53 | 45 | 79 | 21 | 41 |
| Ultralight / Other aircraft type3 | 0 | 0 | 0 | 3 | 8 | 6 | 4 | 4 | 6 | 0 | 0 |
| Incidents by province/territory1 | 573 | 530 | 579 | 654 | 711 | 737 | 866 | 769 | 835 | 385 | 472 |
| Newfoundland and Labrador | 10 | 10 | 17 | 13 | 20 | 22 | 22 | 22 | 15 | 8 | 14 |
| Prince Edward Island | 0 | 0 | 1 | 0 | 1 | 4 | 1 | 2 | 1 | 1 | 1 |
| Nova Scotia | 14 | 9 | 9 | 19 | 17 | 12 | 17 | 20 | 26 | 11 | 5 |
| New Brunswick | 5 | 7 | 4 | 6 | 9 | 9 | 3 | 6 | 8 | 2 | 6 |
| Quebec | 104 | 84 | 96 | 81 | 103 | 99 | 127 | 122 | 125 | 68 | 73 |
| Ontario | 146 | 127 | 142 | 139 | 141 | 148 | 202 | 129 | 146 | 85 | 109 |
| Manitoba | 30 | 30 | 27 | 45 | 51 | 44 | 47 | 38 | 44 | 25 | 40 |
| Saskatchewan | 11 | 14 | 26 | 27 | 19 | 25 | 18 | 14 | 24 | 13 | 19 |
| Alberta | 76 | 75 | 93 | 93 | 110 | 103 | 102 | 97 | 100 | 38 | 35 |
| British Columbia | 68 | 87 | 93 | 125 | 137 | 118 | 100 | 114 | 124 | 52 | 70 |
| Yukon | 3 | 3 | 3 | 5 | 6 | 5 | 3 | 2 | 8 | 1 | 5 |
| Northwest Territories | 30 | 17 | 16 | 25 | 17 | 8 | 20 | 21 | 8 | 10 | 12 |
| Nunavut | 16 | 15 | 10 | 16 | 14 | 15 | 14 | 16 | 14 | 3 | 10 |
| Other airspace under Canadian air traffic control | 6 | 4 | 4 | 5 | 8 | 8 | 9 | 5 | 11 | 2 | 1 |
| Outside Canada | 54 | 48 | 38 | 55 | 58 | 117 | 181 | 161 | 181 | 66 | 72 |
|
Data extracted 15 March 2022 1 Under the 2014 TSB Regulations, reportable aviation incidents include a) aircraft having a maximum certificated take-off weight greater than 2250 kg (formerly 5700 kg); b) aircraft being operated under an air operator certificate issued under the Canadian Aviation Regulations, Part VII. 2 Breakdowns may not add up to totals. For example, when an occurrence involves an airplane and a helicopter, the occurrence is counted in each type, but only once in the total. 3 Includes balloons, gyroplanes, gliders, airships, hang gliders, remotely piloted aircraft systems (RPAS) and similar aircraft types. 4 "Aircraft involved in accidents" are aircraft counts; all other data are accident counts. |
|||||||||||
| 2011 | 2012 | 2013 | 2014 | 2015 | 2016 | 2017 | 2018 | 2019 | 2020 | 2021 | Total | |
|---|---|---|---|---|---|---|---|---|---|---|---|---|
| Standing/Taxiing | 18 | 17 | 23 | 16 | 19 | 16 | 20 | 13 | 14 | 4 | 6 | 166 |
| Collision with object | 6 | 7 | 8 | 6 | 3 | 5 | 9 | 6 | 5 | 1 | 5 | 61 |
| Collision with moving aircraft | 1 | 2 | 1 | 3 | 5 | 4 | 3 | 3 | 2 | 1 | 3 | 28 |
| Nosedown/Overturned | 3 | 3 | 5 | 1 | 3 | 2 | 2 | 0 | 1 | 0 | 0 | 20 |
| Landing gear collapse/retracted | 3 | 0 | 2 | 1 | 2 | 1 | 3 | 1 | 2 | 0 | 0 | 15 |
| Loss of control | 0 | 3 | 4 | 1 | 0 | 0 | 0 | 0 | 0 | 0 | 0 | 8 |
| Other events | 9 | 9 | 11 | 9 | 12 | 13 | 14 | 10 | 10 | 3 | 4 | 104 |
| Takeoff | 41 | 54 | 40 | 48 | 53 | 47 | 45 | 35 | 48 | 30 | 40 | 481 |
| Collision with terrain | 11 | 21 | 11 | 10 | 18 | 13 | 15 | 7 | 14 | 4 | 12 | 136 |
| Loss of control | 12 | 17 | 7 | 18 | 9 | 11 | 7 | 5 | 11 | 3 | 10 | 110 |
| Collision with object | 9 | 17 | 8 | 11 | 18 | 12 | 8 | 11 | 17 | 12 | 10 | 133 |
| Takeoff/landing event | 13 | 19 | 9 | 11 | 11 | 14 | 16 | 11 | 11 | 8 | 13 | 136 |
| Power loss | 11 | 6 | 13 | 16 | 12 | 10 | 11 | 5 | 12 | 6 | 2 | 104 |
| Other events | 28 | 33 | 26 | 34 | 50 | 30 | 35 | 31 | 38 | 28 | 36 | 369 |
| En route | 31 | 30 | 34 | 23 | 29 | 19 | 34 | 27 | 28 | 24 | 19 | 298 |
| Power loss | 14 | 15 | 15 | 14 | 8 | 12 | 15 | 11 | 12 | 8 | 5 | 129 |
| Precautionary/forced landing / Ditching | 13 | 9 | 8 | 7 | 5 | 4 | 5 | 6 | 8 | 4 | 6 | 75 |
| Collision with terrain | 8 | 7 | 10 | 5 | 4 | 5 | 5 | 5 | 6 | 3 | 2 | 60 |
| Component/system related | 1 | 2 | 3 | 2 | 3 | 0 | 3 | 1 | 2 | 3 | 1 | 21 |
| Other events | 18 | 14 | 18 | 14 | 26 | 8 | 24 | 22 | 21 | 19 | 15 | 199 |
| Manoeuvering | 12 | 11 | 12 | 4 | 11 | 13 | 11 | 12 | 15 | 14 | 4 | 119 |
| Collision with terrain | 6 | 8 | 7 | 1 | 7 | 6 | 7 | 4 | 5 | 6 | 1 | 58 |
| Loss of control | 1 | 4 | 1 | 1 | 2 | 4 | 5 | 4 | 0 | 3 | 1 | 26 |
| Collision with object | 1 | 1 | 2 | 1 | 2 | 3 | 1 | 2 | 5 | 3 | 0 | 21 |
| Power loss | 3 | 1 | 0 | 0 | 1 | 2 | 1 | 1 | 1 | 2 | 1 | 13 |
| Other events | 9 | 2 | 5 | 3 | 4 | 6 | 2 | 8 | 12 | 7 | 3 | 61 |
| Approach | 23 | 21 | 32 | 28 | 25 | 17 | 21 | 25 | 27 | 24 | 20 | 263 |
| Collision with terrain | 7 | 6 | 6 | 7 | 10 | 4 | 7 | 5 | 8 | 1 | 3 | 64 |
| Power loss | 2 | 0 | 11 | 6 | 2 | 3 | 6 | 6 | 5 | 6 | 3 | 50 |
| Collision with object | 8 | 1 | 7 | 9 | 7 | 6 | 7 | 3 | 2 | 5 | 0 | 55 |
| Component/system related | 5 | 3 | 3 | 4 | 2 | 0 | 2 | 3 | 3 | 2 | 1 | 28 |
| Precautionary/forced landing / Ditching | 2 | 2 | 7 | 7 | 1 | 1 | 4 | 5 | 7 | 4 | 2 | 42 |
| Loss of control | 3 | 4 | 5 | 1 | 4 | 1 | 0 | 1 | 5 | 0 | 2 | 26 |
| Other events | 8 | 14 | 10 | 9 | 18 | 12 | 13 | 18 | 21 | 18 | 16 | 157 |
| Landing | 113 | 111 | 116 | 99 | 118 | 113 | 95 | 92 | 93 | 80 | 83 | 1113 |
| Missed or went off runway | 27 | 26 | 28 | 14 | 30 | 30 | 21 | 17 | 23 | 20 | 18 | 254 |
| Collision with object | 28 | 26 | 18 | 20 | 29 | 24 | 23 | 29 | 25 | 18 | 19 | 259 |
| Landing gear collapsed/retracted | 24 | 22 | 25 | 17 | 27 | 27 | 23 | 19 | 17 | 18 | 18 | 237 |
| Nosedown/Overturned | 17 | 20 | 20 | 17 | 27 | 33 | 29 | 23 | 21 | 19 | 25 | 251 |
| Loss of control | 17 | 27 | 19 | 22 | 2 | 3 | 6 | 3 | 4 | 0 | 3 | 106 |
| Hard landing | 22 | 20 | 13 | 14 | 10 | 17 | 19 | 16 | 17 | 7 | 11 | 166 |
| Collision with terrain | 16 | 18 | 12 | 21 | 20 | 12 | 7 | 11 | 10 | 8 | 4 | 139 |
| Wheels-up landing | 3 | 7 | 10 | 7 | 10 | 9 | 4 | 5 | 7 | 1 | 3 | 66 |
| Precautionary/forced landing / Ditching | 3 | 9 | 11 | 5 | 12 | 18 | 18 | 7 | 7 | 9 | 7 | 106 |
| Other events | 49 | 42 | 45 | 28 | 77 | 77 | 50 | 58 | 53 | 53 | 50 | 582 |
| Post-impact | 11 | 19 | 13 | 16 | 37 | 57 | 41 | 44 | 31 | 9 | 6 | 284 |
| Fire/Explosion/Fumes | 6 | 7 | 7 | 6 | 13 | 9 | 5 | 7 | 5 | 4 | 0 | 69 |
| Other events | 5 | 12 | 6 | 12 | 24 | 49 | 37 | 38 | 26 | 5 | 6 | 220 |
|
Data extracted 15 March 2022 1 Breakdowns do not add up to totals. For example, in the take-off phase, if an occurrence involves both "Loss of control" and "Power loss" events, the occurrence is counted in each event category, but only once in the phase total. |
||||||||||||
| 2011 | 2012 | 2013 | 2014 | 2015 | 2016 | 2017 | 2018 | 2019 | 2020 | 2021 | Total | |
|---|---|---|---|---|---|---|---|---|---|---|---|---|
| Standing/Taxiing | 6 | 4 | 1 | 4 | 2 | 0 | 1 | 4 | 3 | 0 | 2 | 27 |
| Collision with terrain | 2 | 1 | 0 | 0 | 1 | 0 | 0 | 0 | 0 | 0 | 0 | 4 |
| Loss of control | 2 | 0 | 0 | 2 | 1 | 0 | 0 | 0 | 2 | 0 | 1 | 8 |
| Collision with object | 0 | 0 | 0 | 2 | 1 | 0 | 1 | 1 | 1 | 0 | 0 | 6 |
| Other events | 5 | 4 | 1 | 4 | 0 | 0 | 0 | 4 | 2 | 0 | 2 | 22 |
| Takeoff | 7 | 7 | 7 | 9 | 4 | 6 | 5 | 5 | 6 | 1 | 8 | 65 |
| Loss of control | 4 | 2 | 0 | 5 | 1 | 4 | 4 | 1 | 3 | 0 | 4 | 28 |
| Collision with terrain | 3 | 1 | 2 | 1 | 2 | 1 | 1 | 2 | 2 | 0 | 1 | 16 |
| Collision with object | 0 | 4 | 2 | 2 | 1 | 0 | 1 | 2 | 3 | 0 | 2 | 17 |
| Power loss | 2 | 0 | 1 | 1 | 0 | 1 | 0 | 0 | 0 | 0 | 1 | 6 |
| Other events | 1 | 2 | 2 | 4 | 1 | 3 | 2 | 2 | 4 | 1 | 6 | 28 |
| En route | 10 | 9 | 5 | 7 | 4 | 5 | 3 | 6 | 4 | 5 | 7 | 65 |
| Collision with terrain | 3 | 3 | 1 | 3 | 1 | 1 | 1 | 2 | 2 | 1 | 2 | 20 |
| Power loss | 2 | 3 | 1 | 1 | 1 | 3 | 0 | 1 | 1 | 1 | 2 | 16 |
| Precautionary/forced landing / Ditching | 0 | 1 | 1 | 0 | 1 | 0 | 0 | 0 | 0 | 0 | 1 | 4 |
| Component/system related | 2 | 0 | 1 | 0 | 1 | 0 | 0 | 0 | 1 | 0 | 2 | 7 |
| Other events | 7 | 6 | 4 | 5 | 3 | 4 | 3 | 5 | 1 | 5 | 5 | 48 |
| Manoeuvering | 10 | 11 | 8 | 4 | 8 | 8 | 7 | 4 | 9 | 5 | 9 | 83 |
| Collision with terrain | 6 | 5 | 5 | 2 | 3 | 5 | 3 | 2 | 2 | 2 | 3 | 38 |
| Loss of control | 2 | 3 | 2 | 2 | 2 | 3 | 4 | 0 | 2 | 2 | 4 | 26 |
| Collision with object | 3 | 3 | 2 | 1 | 1 | 3 | 3 | 1 | 4 | 1 | 2 | 24 |
| Operations related event | 2 | 2 | 1 | 0 | 2 | 5 | 3 | 1 | 6 | 1 | 1 | 24 |
| Power loss | 0 | 2 | 1 | 0 | 2 | 1 | 1 | 0 | 1 | 0 | 0 | 8 |
| Other events | 3 | 6 | 2 | 2 | 5 | 5 | 5 | 2 | 7 | 4 | 3 | 44 |
| Approach | 6 | 7 | 3 | 3 | 3 | 5 | 2 | 2 | 1 | 1 | 3 | 36 |
| Collision with terrain | 1 | 1 | 0 | 0 | 0 | 1 | 0 | 0 | 0 | 0 | 2 | 5 |
| Power loss | 0 | 2 | 0 | 1 | 1 | 3 | 0 | 0 | 0 | 0 | 1 | 8 |
| Loss of control | 1 | 1 | 0 | 1 | 1 | 2 | 1 | 1 | 0 | 0 | 0 | 8 |
| Collision with object | 2 | 0 | 0 | 1 | 0 | 1 | 1 | 0 | 0 | 0 | 0 | 5 |
| Other events | 3 | 5 | 3 | 2 | 2 | 4 | 1 | 1 | 1 | 1 | 2 | 25 |
| Landing | 7 | 13 | 12 | 12 | 18 | 16 | 13 | 12 | 12 | 9 | 12 | 136 |
| Hard landing | 4 | 4 | 1 | 3 | 1 | 0 | 1 | 2 | 0 | 0 | 0 | 16 |
| Collision with terrain | 2 | 4 | 0 | 3 | 6 | 0 | 0 | 2 | 1 | 1 | 0 | 19 |
| Loss of control | 1 | 1 | 2 | 4 | 6 | 2 | 1 | 2 | 3 | 6 | 2 | 30 |
| Collision with object | 2 | 2 | 5 | 5 | 1 | 4 | 3 | 6 | 2 | 5 | 1 | 36 |
| Other events | 2 | 4 | 9 | 5 | 10 | 4 | 5 | 5 | 7 | 5 | 3 | 59 |
| Post-impact | 4 | 2 | 3 | 2 | 5 | 11 | 1 | 6 | 5 | 2 | 5 | 46 |
| Fire/Explosion/Fumes | 2 | 1 | 2 | 0 | 1 | 0 | 0 | 0 | 3 | 2 | 2 | 13 |
| Other events | 2 | 1 | 1 | 2 | 4 | 11 | 1 | 6 | 4 | 0 | 4 | 36 |
|
Data extracted 15 March 2022 1 Breakdowns do not add up to totals. For example, in the take-off phase, if an occurrence involves both "Loss of control" and "Power loss" events, the occurrence is counted in each event category, but only once in the phase total. |
||||||||||||
| 2011 | 2012 | 2013 | 2014 | 2015 | 2016 | 2017 | 2018 | 2019 | 2020 | 2021 | Total | |
|---|---|---|---|---|---|---|---|---|---|---|---|---|
| Standing/Taxiing | 1 | 1 | 1 | 0 | 1 | 2 | 1 | 0 | 1 | 1 | 0 | 9 |
| Collision with object | 0 | 0 | 0 | 0 | 0 | 0 | 0 | 0 | 0 | 0 | 0 | 0 |
| Collision with moving aircraft | 0 | 0 | 0 | 0 | 0 | 0 | 0 | 0 | 0 | 0 | 0 | 0 |
| Nosedown/Overturned | 0 | 0 | 0 | 0 | 0 | 0 | 0 | 0 | 0 | 0 | 0 | 0 |
| Landing gear collapsed/retracted | 0 | 0 | 0 | 0 | 0 | 0 | 0 | 0 | 0 | 0 | 0 | 0 |
| Loss of control | 0 | 0 | 0 | 0 | 0 | 0 | 0 | 0 | 0 | 0 | 0 | 0 |
| Other events | 1 | 1 | 1 | 0 | 1 | 2 | 1 | 0 | 1 | 1 | 0 | 9 |
| Takeoff | 4 | 6 | 4 | 2 | 9 | 5 | 6 | 5 | 7 | 1 | 7 | 56 |
| Collision with terrain | 1 | 4 | 3 | 0 | 4 | 4 | 5 | 2 | 5 | 0 | 6 | 34 |
| Loss of control | 2 | 2 | 2 | 1 | 4 | 4 | 2 | 2 | 2 | 0 | 2 | 23 |
| Collision with object | 1 | 2 | 0 | 0 | 1 | 0 | 1 | 1 | 1 | 0 | 0 | 7 |
| Takeoff/landing event | 1 | 1 | 1 | 1 | 0 | 0 | 1 | 0 | 0 | 1 | 1 | 7 |
| Power loss | 1 | 0 | 0 | 1 | 1 | 1 | 1 | 0 | 1 | 0 | 0 | 6 |
| Other events | 4 | 3 | 2 | 0 | 7 | 1 | 4 | 4 | 3 | 1 | 5 | 34 |
| En route | 9 | 8 | 9 | 3 | 7 | 5 | 5 | 6 | 10 | 2 | 3 | 67 |
| Power loss | 2 | 1 | 0 | 0 | 0 | 2 | 0 | 1 | 2 | 0 | 0 | 8 |
| Precautionary/forced landing / Ditching | 1 | 0 | 0 | 0 | 0 | 1 | 0 | 0 | 1 | 0 | 1 | 4 |
| Collision with terrain | 5 | 6 | 7 | 3 | 4 | 4 | 3 | 5 | 6 | 1 | 2 | 46 |
| Component/system related | 0 | 0 | 0 | 0 | 1 | 0 | 0 | 0 | 0 | 0 | 0 | 1 |
| Other events | 4 | 2 | 5 | 1 | 6 | 2 | 4 | 5 | 7 | 1 | 3 | 40 |
| Manoeuvering | 1 | 4 | 3 | 2 | 4 | 5 | 4 | 5 | 4 | 4 | 0 | 36 |
| Collision with terrain | 1 | 4 | 2 | 1 | 4 | 4 | 4 | 3 | 4 | 3 | 0 | 30 |
| Loss of control | 0 | 2 | 0 | 1 | 0 | 2 | 2 | 4 | 0 | 1 | 0 | 12 |
| Collision with object | 0 | 0 | 0 | 0 | 1 | 1 | 1 | 0 | 0 | 1 | 0 | 4 |
| Power loss | 0 | 0 | 0 | 0 | 0 | 0 | 0 | 0 | 0 | 0 | 0 | 0 |
| Other events | 1 | 0 | 1 | 1 | 0 | 1 | 1 | 3 | 2 | 1 | 0 | 11 |
| Approach | 6 | 5 | 5 | 1 | 5 | 4 | 4 | 4 | 4 | 0 | 1 | 39 |
| Collision with terrain | 4 | 3 | 5 | 0 | 3 | 3 | 3 | 2 | 2 | 0 | 1 | 26 |
| Power loss | 1 | 0 | 1 | 0 | 0 | 0 | 0 | 0 | 0 | 0 | 0 | 2 |
| Collision with object | 2 | 0 | 0 | 0 | 1 | 1 | 1 | 0 | 0 | 0 | 0 | 5 |
| Component/system related | 0 | 0 | 0 | 0 | 0 | 0 | 1 | 0 | 2 | 0 | 0 | 3 |
| Precautionary/forced landing / Ditching | 1 | 0 | 0 | 0 | 0 | 0 | 0 | 0 | 0 | 0 | 0 | 1 |
| Loss of control | 0 | 1 | 2 | 0 | 0 | 1 | 0 | 0 | 1 | 0 | 0 | 5 |
| Other events | 1 | 4 | 1 | 1 | 2 | 2 | 2 | 2 | 3 | 0 | 0 | 18 |
| Landing | 5 | 3 | 3 | 4 | 4 | 5 | 0 | 1 | 4 | 0 | 3 | 32 |
| Missed or went off runway | 0 | 0 | 0 | 1 | 0 | 1 | 0 | 0 | 0 | 0 | 0 | 2 |
| Collision with object | 1 | 0 | 0 | 0 | 1 | 1 | 0 | 1 | 2 | 0 | 2 | 8 |
| Landing gear collapsed/retracted | 0 | 0 | 0 | 0 | 0 | 0 | 0 | 0 | 0 | 0 | 0 | 0 |
| Nosedown/Overturned | 1 | 1 | 2 | 1 | 0 | 0 | 0 | 1 | 2 | 0 | 0 | 8 |
| Loss of control | 0 | 0 | 1 | 0 | 0 | 0 | 0 | 0 | 0 | 0 | 0 | 1 |
| Hard landing | 0 | 1 | 0 | 0 | 0 | 0 | 0 | 0 | 0 | 0 | 0 | 1 |
| Collision with terrain | 2 | 3 | 2 | 2 | 2 | 4 | 0 | 0 | 1 | 0 | 0 | 16 |
| Wheels-up landing | 0 | 0 | 0 | 0 | 0 | 0 | 0 | 0 | 0 | 0 | 0 | 0 |
| Precautionary/forced landing / Ditching | 0 | 0 | 1 | 0 | 1 | 0 | 0 | 0 | 0 | 0 | 0 | 2 |
| Other events | 1 | 2 | 0 | 2 | 1 | 3 | 0 | 1 | 2 | 0 | 2 | 14 |
| Post-impact | 6 | 8 | 8 | 4 | 10 | 9 | 5 | 8 | 4 | 1 | 0 | 63 |
| Fire/Explosion/Fumes | 4 | 6 | 7 | 3 | 10 | 7 | 4 | 6 | 3 | 1 | 0 | 51 |
| Other events | 2 | 2 | 1 | 2 | 0 | 2 | 1 | 2 | 1 | 0 | 0 | 13 |
|
Data extracted 15 March 2022 1 Breakdowns do not add up to totals. For example, in the takeoff phase, if an occurrence involves both "Loss of control" and "Power loss" events, the occurrence is counted in each event category, but only once in the phase total. |
||||||||||||
| 2011 | 2012 | 2013 | 2014 | 2015 | 2016 | 2017 | 2018 | 2019 | 2020 | 2021 | Total | |
|---|---|---|---|---|---|---|---|---|---|---|---|---|
| Standing/Taxiing | 0 | 0 | 0 | 0 | 0 | 0 | 0 | 0 | 0 | 0 | 0 | 0 |
| Collision with terrain | 0 | 0 | 0 | 0 | 0 | 0 | 0 | 0 | 0 | 0 | 0 | 0 |
| Loss of control | 0 | 0 | 0 | 0 | 0 | 0 | 0 | 0 | 0 | 0 | 0 | 0 |
| Collision with object | 0 | 0 | 0 | 0 | 0 | 0 | 0 | 0 | 0 | 0 | 0 | 0 |
| Other events | 0 | 0 | 0 | 0 | 0 | 0 | 0 | 0 | 0 | 0 | 0 | 0 |
| Takeoff | 2 | 0 | 2 | 0 | 1 | 0 | 0 | 0 | 0 | 1 | 0 | 6 |
| Loss of control | 0 | 0 | 0 | 0 | 0 | 0 | 0 | 0 | 0 | 0 | 0 | 0 |
| Collision with terrain | 1 | 0 | 1 | 0 | 1 | 0 | 0 | 0 | 0 | 0 | 0 | 3 |
| Collision with object | 0 | 0 | 1 | 0 | 1 | 0 | 0 | 0 | 0 | 0 | 0 | 2 |
| Power loss | 1 | 0 | 0 | 0 | 0 | 0 | 0 | 0 | 0 | 0 | 0 | 1 |
| Other events | 0 | 0 | 0 | 0 | 0 | 0 | 0 | 0 | 0 | 1 | 0 | 1 |
| En route | 2 | 3 | 2 | 0 | 2 | 1 | 1 | 4 | 3 | 0 | 2 | 20 |
| Collision with terrain | 2 | 2 | 1 | 0 | 1 | 1 | 0 | 2 | 2 | 0 | 1 | 12 |
| Power loss | 0 | 0 | 0 | 0 | 0 | 0 | 0 | 0 | 1 | 0 | 0 | 1 |
| Precautionary/forced landing / Ditching | 0 | 0 | 0 | 0 | 0 | 0 | 0 | 0 | 0 | 0 | 0 | 0 |
| Component/system related | 0 | 0 | 0 | 0 | 0 | 0 | 0 | 0 | 1 | 0 | 0 | 1 |
| Other events | 1 | 2 | 2 | 0 | 1 | 1 | 1 | 3 | 0 | 0 | 1 | 12 |
| Manoeuvering | 4 | 3 | 2 | 0 | 1 | 1 | 1 | 1 | 1 | 2 | 3 | 19 |
| Collision with terrain | 3 | 1 | 2 | 0 | 1 | 0 | 1 | 1 | 0 | 1 | 2 | 12 |
| Loss of control | 0 | 1 | 1 | 0 | 0 | 0 | 1 | 0 | 0 | 1 | 1 | 5 |
| Collision with object | 1 | 0 | 0 | 0 | 0 | 1 | 1 | 0 | 0 | 0 | 0 | 3 |
| Operations related event | 0 | 2 | 0 | 0 | 0 | 0 | 1 | 0 | 1 | 1 | 0 | 5 |
| Power loss | 0 | 1 | 0 | 0 | 1 | 0 | 0 | 0 | 0 | 0 | 0 | 2 |
| Other events | 2 | 2 | 0 | 0 | 0 | 1 | 1 | 0 | 1 | 1 | 1 | 9 |
| Approach | 1 | 1 | 0 | 0 | 0 | 0 | 0 | 0 | 0 | 0 | 1 | 3 |
| Collision with terrain | 0 | 0 | 0 | 0 | 0 | 0 | 0 | 0 | 0 | 0 | 1 | 1 |
| Power loss | 0 | 0 | 0 | 0 | 0 | 0 | 0 | 0 | 0 | 0 | 0 | 0 |
| Loss of control | 1 | 1 | 0 | 0 | 0 | 0 | 0 | 0 | 0 | 0 | 0 | 2 |
| Collision with object | 0 | 0 | 0 | 0 | 0 | 0 | 0 | 0 | 0 | 0 | 0 | 0 |
| Other events | 0 | 1 | 0 | 0 | 0 | 0 | 0 | 0 | 0 | 0 | 1 | 2 |
| Landing | 1 | 2 | 0 | 0 | 2 | 0 | 1 | 0 | 1 | 0 | 0 | 7 |
| Hard landing | 0 | 0 | 0 | 0 | 0 | 0 | 0 | 0 | 0 | 0 | 0 | 0 |
| Collision with terrain | 1 | 2 | 0 | 0 | 1 | 0 | 0 | 0 | 0 | 0 | 0 | 4 |
| Loss of control | 0 | 0 | 0 | 0 | 1 | 0 | 0 | 0 | 0 | 0 | 0 | 1 |
| Collision with object | 0 | 0 | 0 | 0 | 0 | 1 | 0 | 2 | 0 | 0 | 0 | 3 |
| Other events | 0 | 0 | 0 | 0 | 0 | 0 | 0 | 0 | 1 | 0 | 0 | 1 |
| Post-impact | 1 | 1 | 2 | 0 | 1 | 0 | 0 | 0 | 0 | 1 | 1 | 7 |
| Fire/Explosion/Fumes | 1 | 1 | 1 | 0 | 1 | 0 | 0 | 0 | 0 | 1 | 1 | 6 |
| Other events | 0 | 0 | 1 | 0 | 0 | 0 | 0 | 0 | 0 | 0 | 0 | 1 |
|
Data extracted 15 March 2022 1 Breakdowns do not add up to totals. For example, in the take-off phase, if an occurrence involves both "Loss of control" and "Power loss" events, the occurrence is counted in each event category, but only once in the phase total. |
||||||||||||
Definitions
The following definitions apply to air transportation occurrences that are required to be reported pursuant to the Canadian Transportation Accident Investigation and Safety Board Act and the Transportation Safety Board Regulations.
Aviation occurrence
- Any accident or incident associated with the operation of an aircraft, and
- any situation or condition that the Board has reasonable grounds to believe could, if left unattended, induce an accident or incident described below.
Reportable aviation accident
An aviation accident is an occurrence resulting directly from the operation of an aircraft in which
- a person is killed or sustains a serious injury as a result of
- being on board the aircraft,
- coming into direct contact with any part of the aircraft, including parts that have become detached from the aircraft, or
- being directly exposed to jet blast, rotor down wash or propeller wash;
- the aircraft sustains structural failure or damage that adversely affects the aircraft's structural strength, performance or flight characteristics and would normally require major repair or replacement of any affected component, except for
- engine failure or damage, when the damage is limited to the engine, its cowlings or accessories, or
- damage limited to propellers, wing tips, antennae, tires, brakes, fairings or small dents or puncture holes in the aircraft's skin; or
- the aircraft is missing or inaccessible.
Reportable aviation incident
An aviation incident is an occurrence resulting directly from the operation of an aircraft having a maximum certificated take-off weight greater than 2250 kg or of an aircraft being operated under an air operator certificate issued under Part VII of the Canadian Aviation Regulations in which,
- an engine fails or is shut down as a precautionary measure;
- a power train transmission gearbox malfunction occurs;
- smoke is detected or a fire occurs on board;
- difficulties in controlling the aircraft are encountered owing to any aircraft system malfunction, weather phenomena, wake turbulence, uncontrolled vibrations or operations outside the flight envelope;
- the aircraft fails to remain within the intended landing or take-off area, lands with all or part of the landing gear retracted or drags a wing tip, an engine pod or any other part of the aircraft;
- a crew member whose duties are directly related to the safe operation of the aircraft is unable to perform their duties as a result of a physical incapacitation which poses a threat to the safety of persons, property or the environment;
- depressurization of the aircraft occurs that requires an emergency descent;
- a fuel shortage occurs that requires a diversion or requires approach and landing priority at the destination of the aircraft;
- the aircraft is refuelled with the incorrect type of fuel or contaminated fuel;
- a minor collision, a risk of collision or a loss of separation occurs;
- a crew member declares an emergency or indicates an emergency that requires priority handling by air traffic services or the standing by of emergency response services;
- a slung load is released unintentionally or as a precautionary or emergency measure from the aircraft; or
- any dangerous goods are released in or from the aircraft.
Collision
Collision means an impact, other than an impact associated with normal operating circumstances, between aircraft or between an aircraft and another object or terrain.
Risk of collision
Risk of collision means a situation in which an aircraft comes so close to being involved in a collision that a threat to the safety of any person, property or the environment exists.
Loss of separation
Loss of separation means a situation in which the distance separating two aircraft is less than the minimum established in the Canadian Domestic Air Traffic Control Separation Standards, published by the Department of Transport, as amended from time to time.
Serious injury
- a fracture of any bone, except simple fractures of fingers, toes or the nose;
- lacerations that cause severe hemorrhage or nerve, muscle or tendon damage,
- an injury to an internal organ;
- second or third degree burns, or any burns affecting more than 5% of the body surface;
- a verified exposure to infectious substances or injurious radiation; or
- an injury that is likely to require hospitalization.
Operation
Operation means the activities for which an aircraft is used from the time any person boards the aircraft with the intention of flight until they disembark.
Operator
Operator has the same meaning as in subsection 101.01(1) of the Canadian Aviation Regulations.
Commercial operators
Commercial operators include carriers that offer a “for-hire” service to transport people or goods, or to undertake specific tasks such as aerial photography, flight training, or crop spraying.
Airliner
An airplane used by a Canadian air operator in an air transport service or in aerial work involving sightseeing operations, that has a MCTOW of more than 8 618 kg (19 000 pounds) or for which a Canadian type certificate has been issued authorizing the transport of 20 or more passengers.
Commuter aircraft
An airplane used by a Canadian air operator, in an air transport service or in aerial work involving sightseeing operations, in which the aircraft is
- a multi-engined aircraft that has a MCTOW of 8618 kg (19 000 pounds) or less and a seating configuration, excluding pilot seats, of 10 to 19, inclusive; or
- a turbo jet powered airplane that has a maximum zero fuel weight of 22 680 kg (50 000 pounds) or less and for which a Canadian type certificate has been issued authorizing the transport of not more than 19 passengers.
Aerial work aircraft
A commercially operated airplane or helicopter used in aerial work involving
- the carriage on board of persons other than flight crew members;
- the carriage of helicopter external loads;
- the towing of objects; or
- the dispersal of products.
Air taxi aircraft
A commercially operated aircraft used in an air transport service or in aerial work involving sightseeing operations, in which the aircraft is
- a single engined aircraft;
- a multi engined aircraft, other than a turbo jet powered airplane, that has a MCTOW of 8618 kg (19 000 pounds) or less and a seating configuration, excluding pilot seats, of nine or less; or
- any aircraft that is authorized by the Minister of Transport to be operated under Part VII, Subpart 3, Division 1 of the CARs.
State operators
State operators include the federal and provincial governments.
Private operators
Private operator means the holder of a private operator registration document issued under subsection 604.04(2) of the CARs.
Recreational operators
Recreational operators include individuals flying for pleasure. Included are flights on which it is not possible to transport people or cargo on a “for-hire” basis.