Main-track train derailment
Canadian National Railway Company
Freight train J60352-12
Mile 44.4, Yale Subdivision
Floods, British Columbia
The Transportation Safety Board of Canada (TSB) investigated this occurrence for the purpose of advancing transportation safety. It is not the function of the Board to assign fault or determine civil or criminal liability. This report is not created for use in the context of legal, disciplinary or other proceedings. See Ownership and use of content. Masculine pronouns and position titles may be used to signify all genders to comply with the Canadian Transportation Accident Investigation and Safety Board Act (S.C. 1989, c. 3).
Summary
On 14 September 2020, at about 0433 Pacific Daylight Time, Canadian National Railway Company freight train J60352-12 was travelling westward at about 50 mph on the Yale Subdivision when 61 cars loaded with potash derailed at Mile 44.4 and piled up between Mile 46.9 and Mile 47.7, in an area near Floods, British Columbia. Fifty-eight of the derailed cars were breached, releasing approximately 6 000 000 kg of product. Small fires along the right-of-way where the train had previously travelled were quickly extinguished. There were no dangerous goods involved. No one was injured.
1.0 Factual information
1.1 The occurrence
On 14 September 2020, a Canadian National Railway Company (CN) train crew was called for 0100Footnote 1 at Boston Bar Yard, in Boston Bar.Footnote 2 The crew was scheduled to operate freight train J60352-12 westward on the Yale Subdivision, from Boston Bar (Mile 0.0) to Douglas Island (Mile 112.8), near Vancouver. The 2 crew members—a locomotive engineer and a conductor—were qualified for their respective positions, met fitness and rest requirements, and were familiar with the Yale Subdivision.
The previous evening, at approximately 2053, a Canadian Pacific Railway Company (CP)Footnote 3 crew, who had taken the train from Kamloops to Boston Bar (Section 1.3), had yarded the train in 2 cuts of cars on separate tracks, secured each cut with at least 5 hand brakesFootnote 4 at the west end of each cut of cars, and performed push-pull tests.
When the CN crew members arrived, they reassembled the train by performing a double-over operation, which consisted in bringing the head-end portion of the train from track 1 to the location of the tail end of the train on track 2 and coupling the 2 cuts of cars back together. This manoeuvre required that the conductor remove the hand brakes from the head-end portion of the train before it left track 1, couple the head end of the train to the 65th car (CNPX 3373, the first car on the tail-end portion on track 2), and then remove the hand brakes from the cars on track 2.
The train consisted of 2 head-end locomotives, 200 covered hopper cars loaded with potash,Footnote 5 and 2 distributed power remote-controlled locomotives on the tail end. It weighed about 28 501 tons and measured approximately 9693 feet. The cars on the train last received, and passed, a certified car inspection on 10 September 2020 at Moose Jaw, Saskatchewan.
Upon departing Boston Bar, the train did not undergo a pull-by inspection as there was no regulatory requirement to do so.Footnote 6 It departed at about 0218.
At 0322, the train passed by a wheel temperature detector (WTD)Footnote 7 at Komo (Mile 13.8) and the WTD alerted CN’s mechanical team of a warm wheel condition on car CNPX 3373. In response, the crew was directed to make a 10 psi brake pipe reduction, with the intention to release a possible stuck air brake on the car, following the release of the brakes.Footnote 8 The locomotive engineer made a positive reduction,Footnote 9 and the train came to a stop at Mile 21.2. After the air brakes were released, the train continued its journey westward.
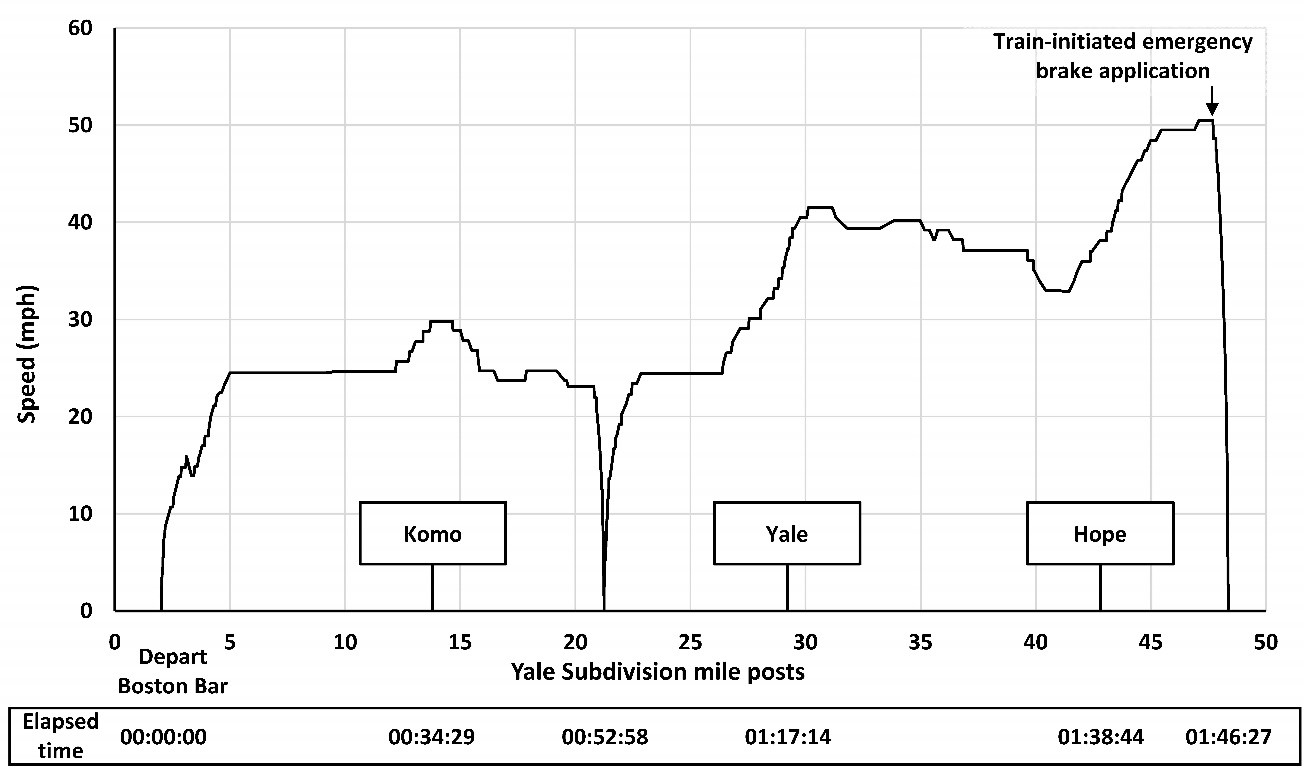
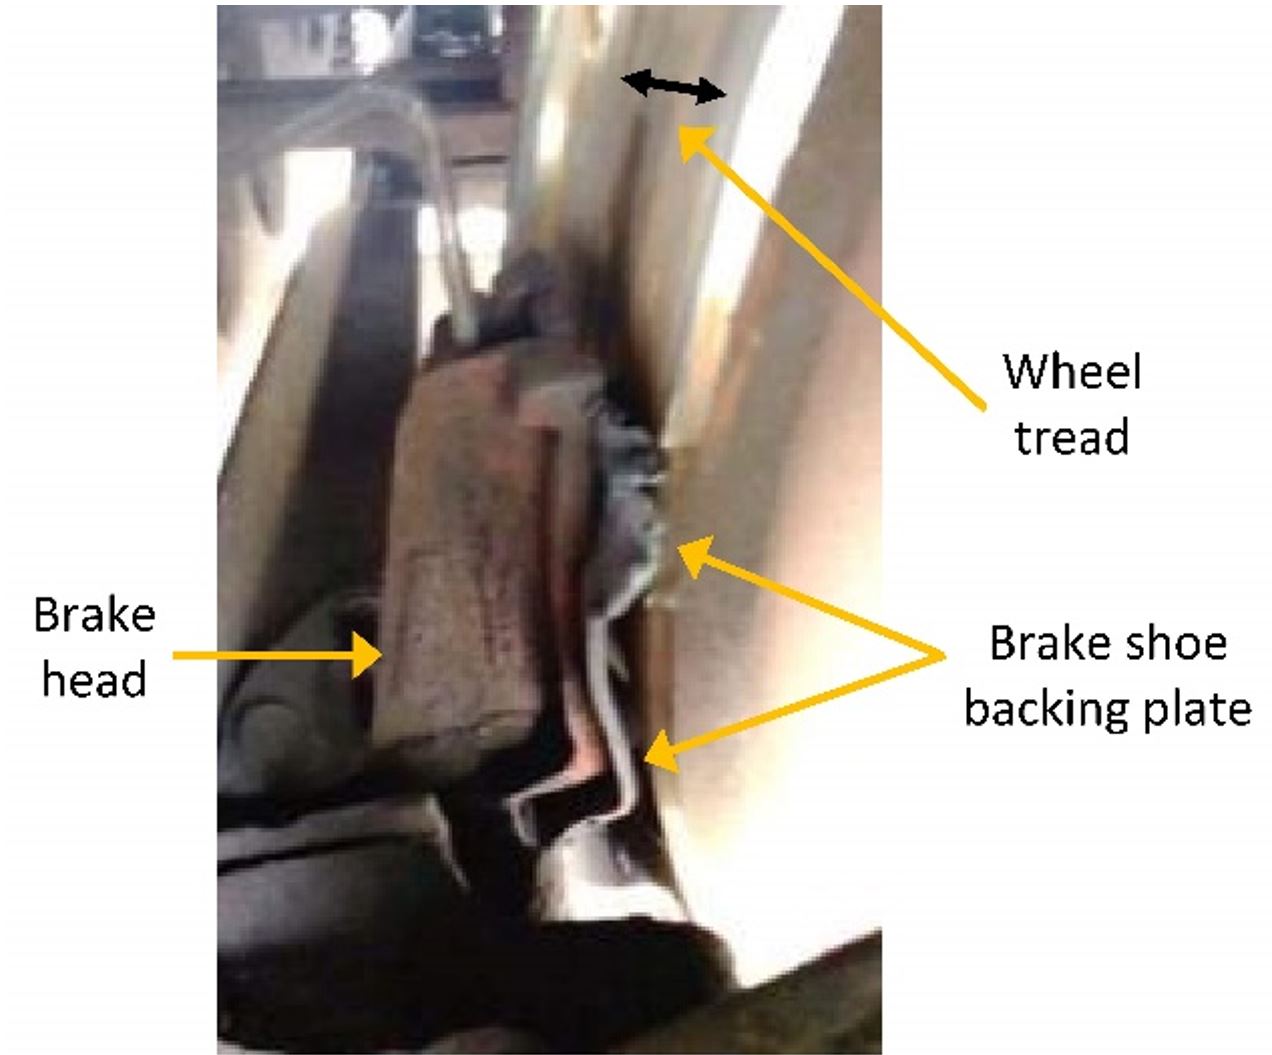
At about 0433, while the train was travelling at about 50 mph around Mile 47.7 near Floods (Figure 1), a train-initiated emergency brake application occurred. Once the head end of the train came to a stop around Mile 48.3, the crew performed an inspection and determined that 61 cars (the 65th to the 125th from the head-end locomotives) had derailed. Before the train-initiated emergency brake application occurred, the crew had not noticed any track or train handling anomalies.
As a result of the derailment, 58 cars loaded with potash were breached, releasing approximately 6 000 000 kg of product. Further to the east, small fires were reported along the right-of-way at Flood Hope Road (Mile 44.6), where the train had previously travelled; they were quickly extinguished by the local fire department.No one was injured.
At the time of the occurrence, the temperature was 12 °C and it was foggy.
1.2 Site examination
The lead locomotive had remained on the track and had come to a stop at around Mile 48.3. The second head-end locomotive and the first 64 cars had also remained on the track. Behind these, 61 cars had derailed and come to rest in various positions along the right-of-way, starting at Mile 46.9 (Hunter Creek Bridge) and extending westward to Mile 47.7 (St. Elmo Road crossing), as follows:
- The 65th through 67th cars had derailed upright, remained attached to the cars ahead, and separated from the rest of the train.
- The 68th through 73rd cars were further east, down the bridge embankment, on their sides.
- The remaining 52 derailed cars were in an accordion fashion in a concentrated pile-up on top of, and west of, the bridge.
The last 75 cars and the 2 tail-end remote locomotives had remained on the track, just east of the bridge.
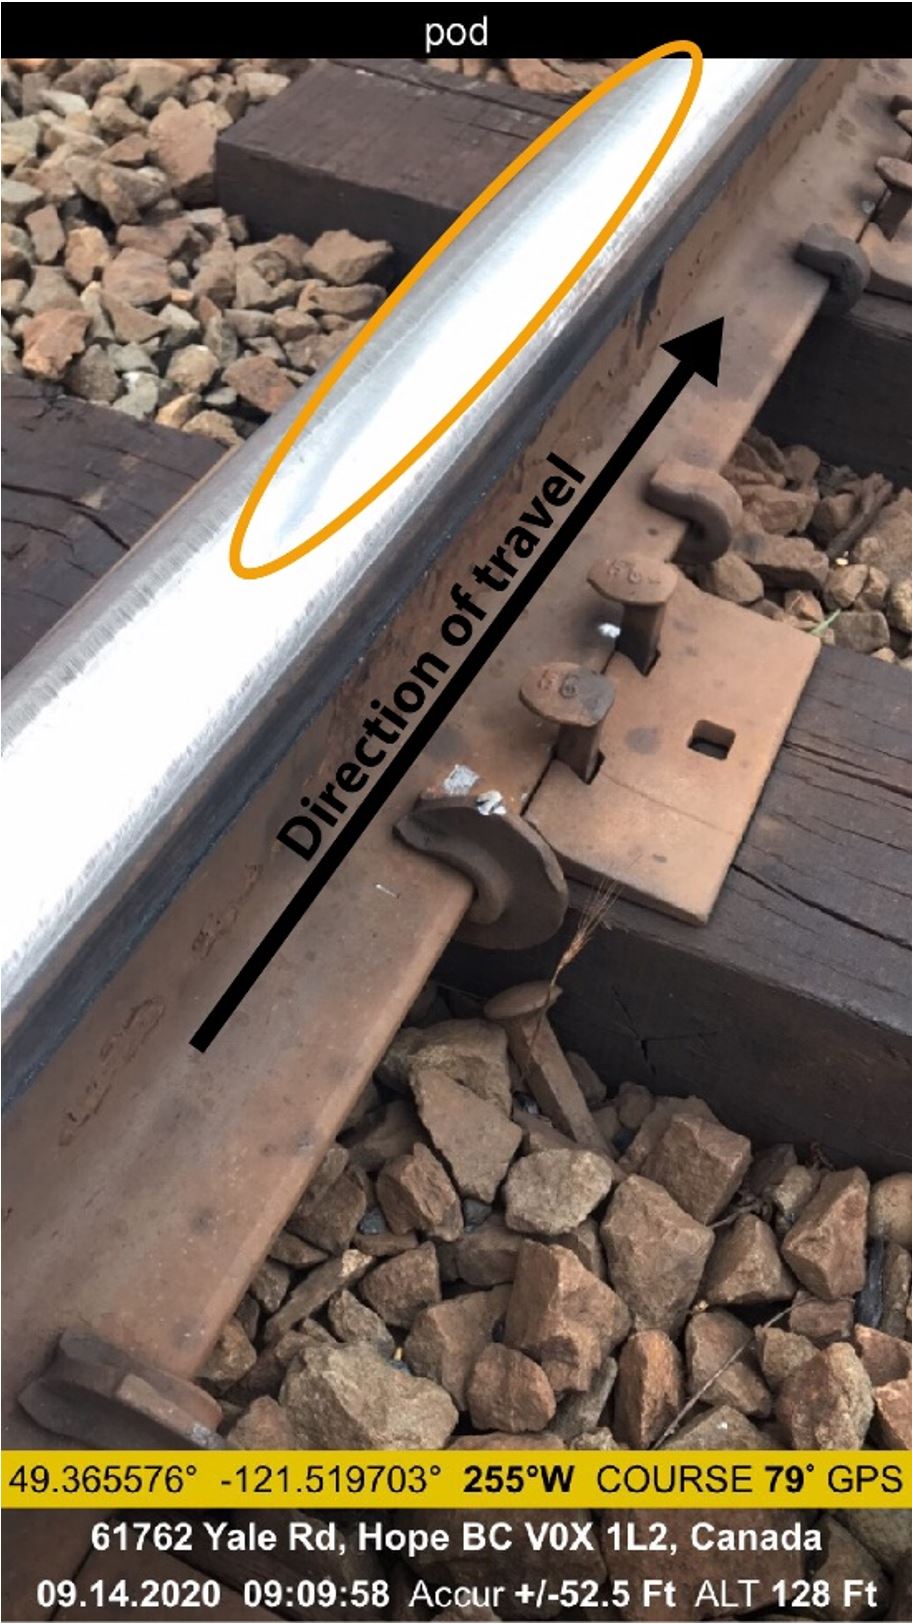
The initial point of derailment (POD) was determined to be at about Mile 44.4 of the Yale Subdivision (Figure 2).
1.2.1 Examination of the first derailed car
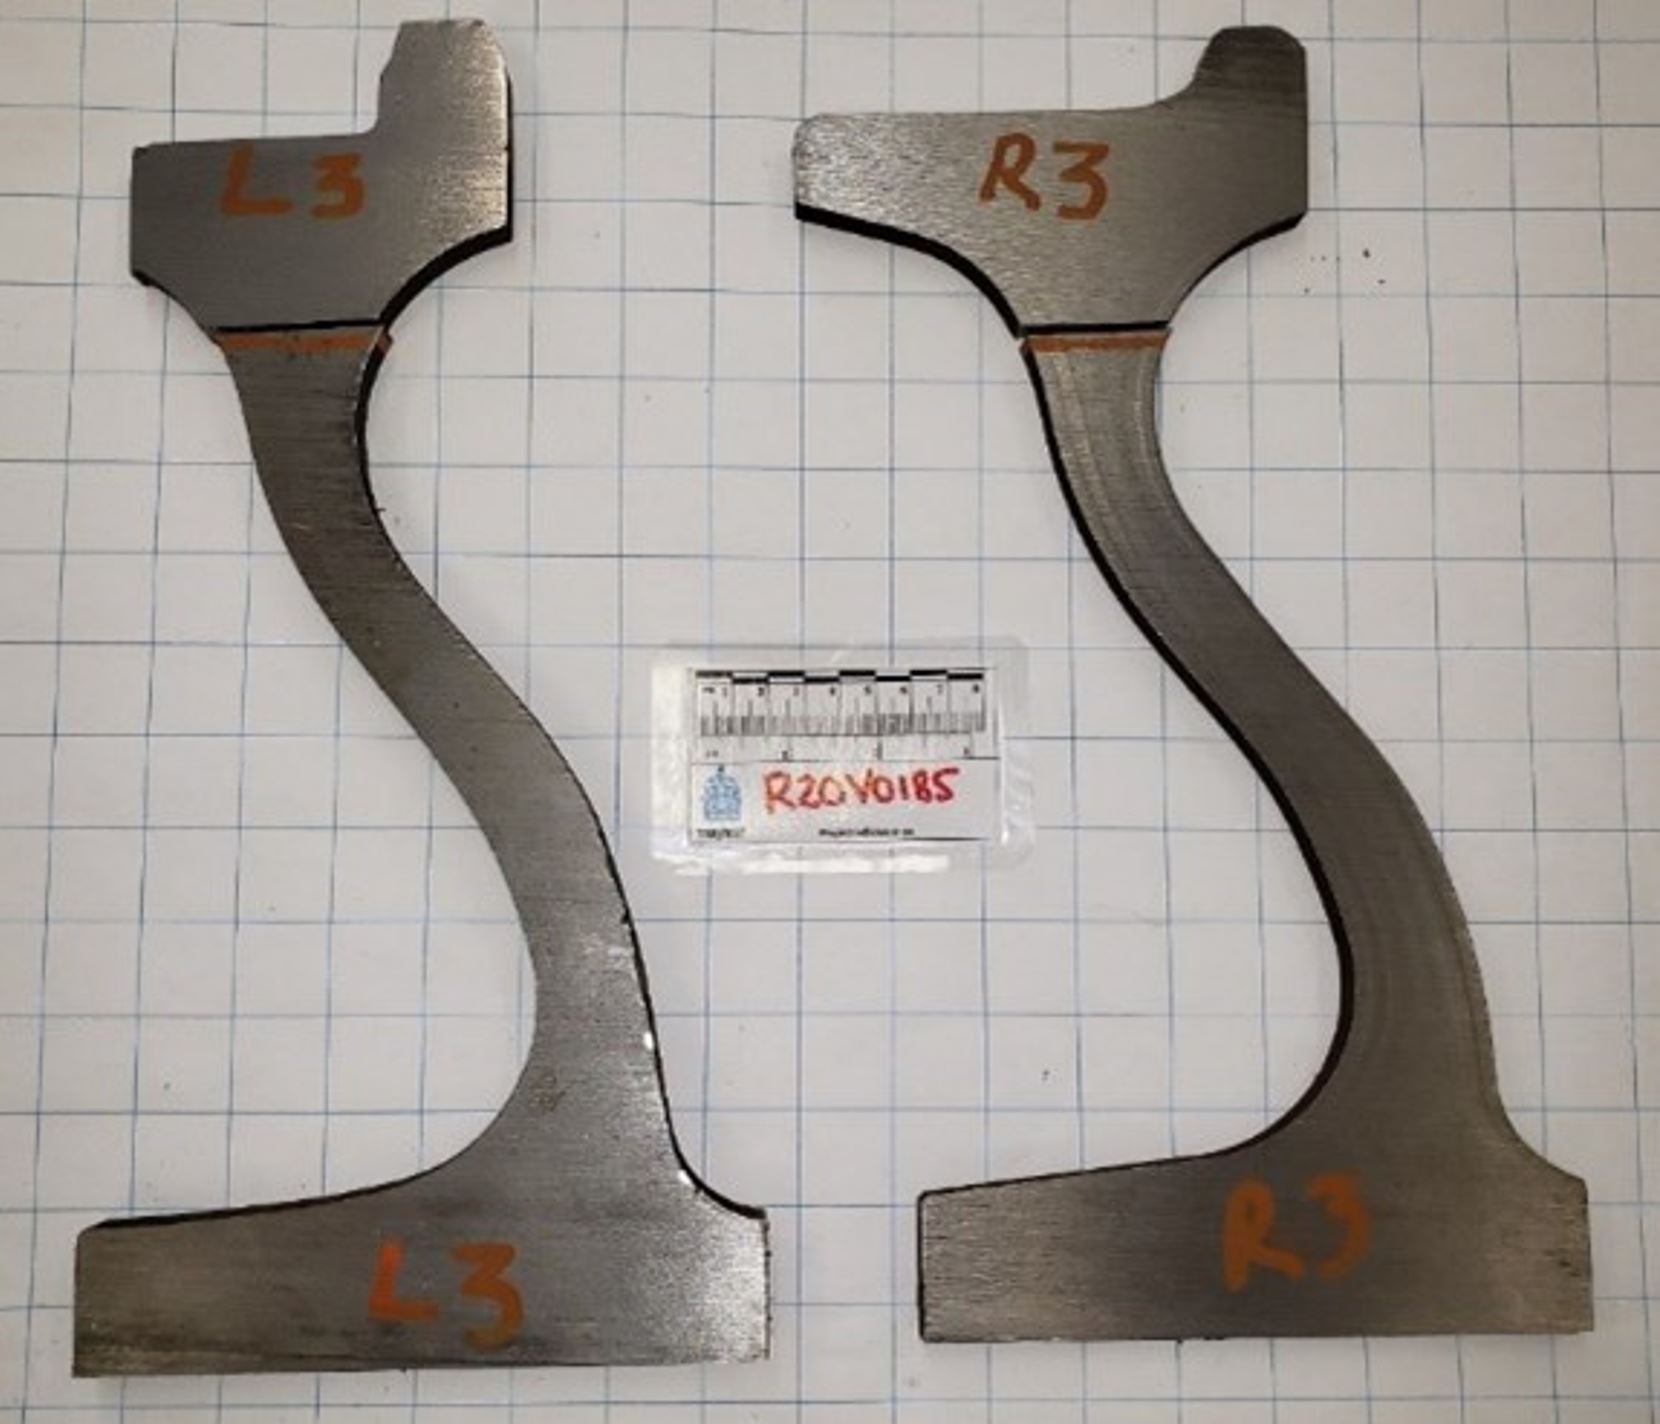
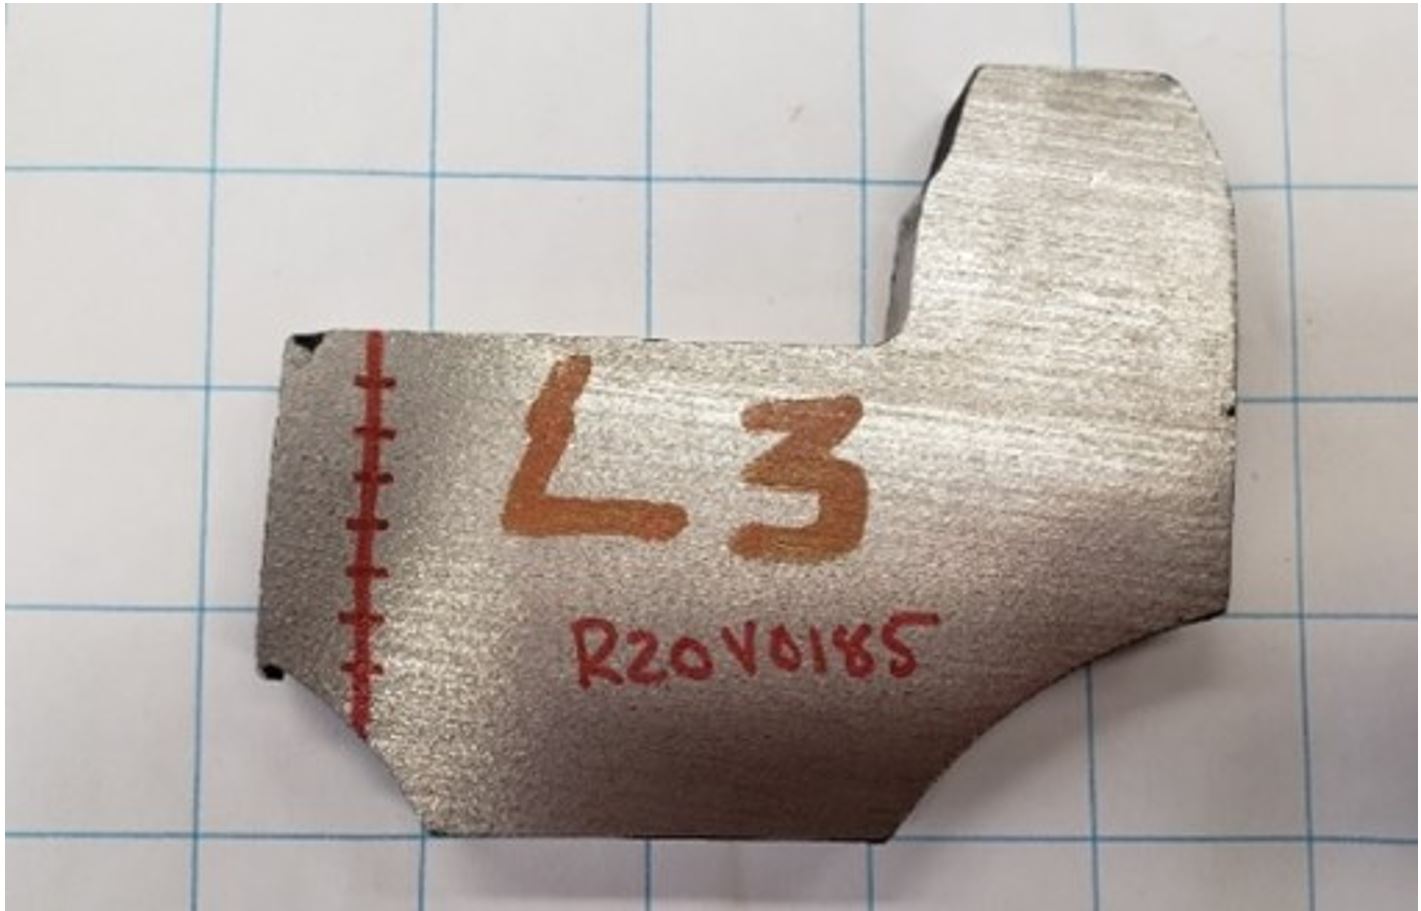
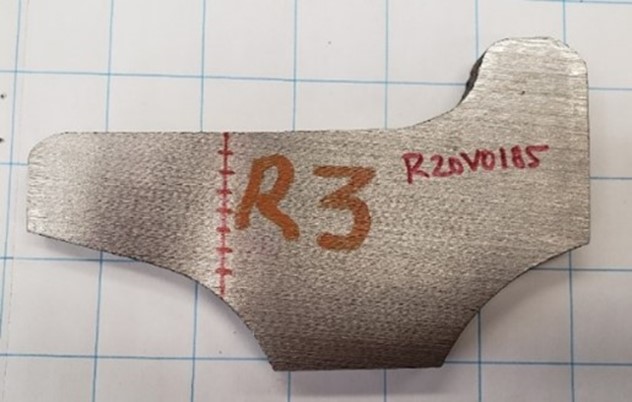
The 65th car (CNPX 3373), a covered hopper car, was the first to derail. It had come to rest upright near the St. Elmo Road crossing (Mile 47.7) and was still attached to the head-end portion of the train.
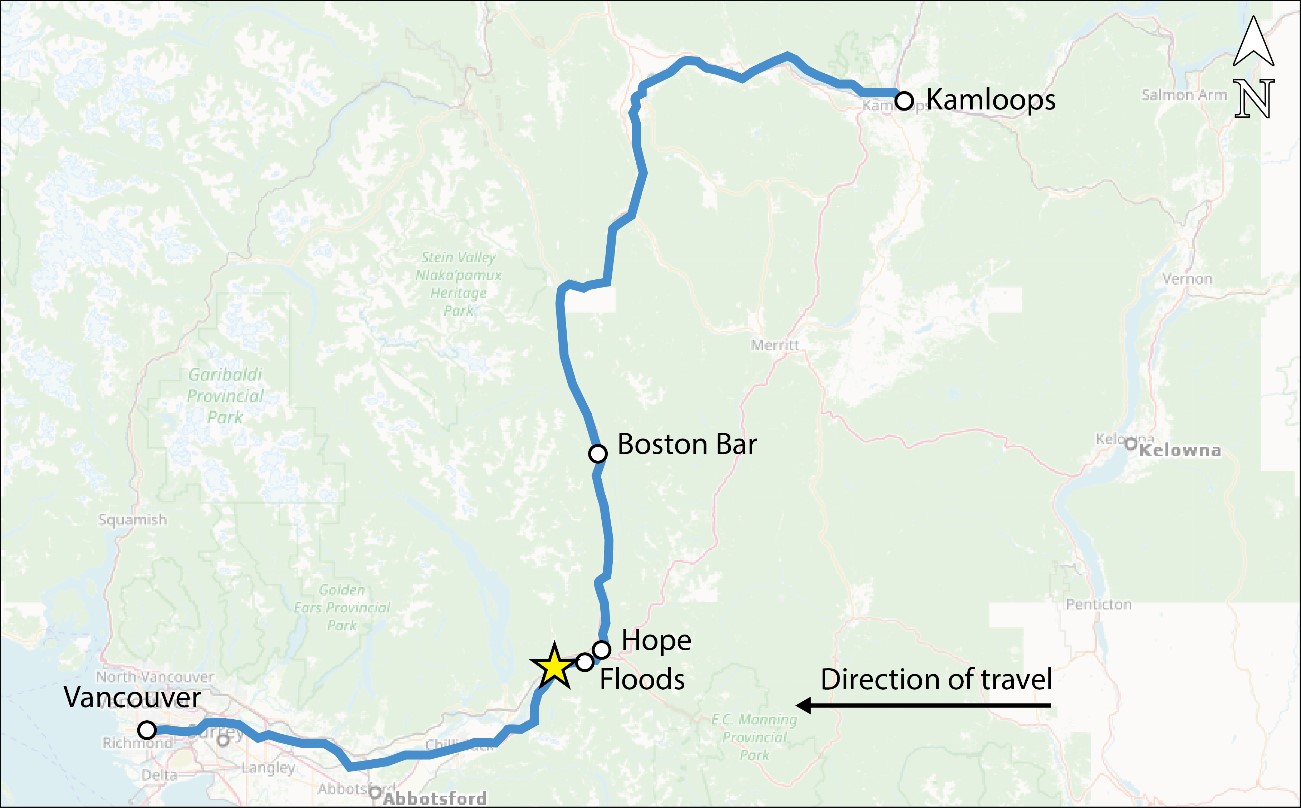
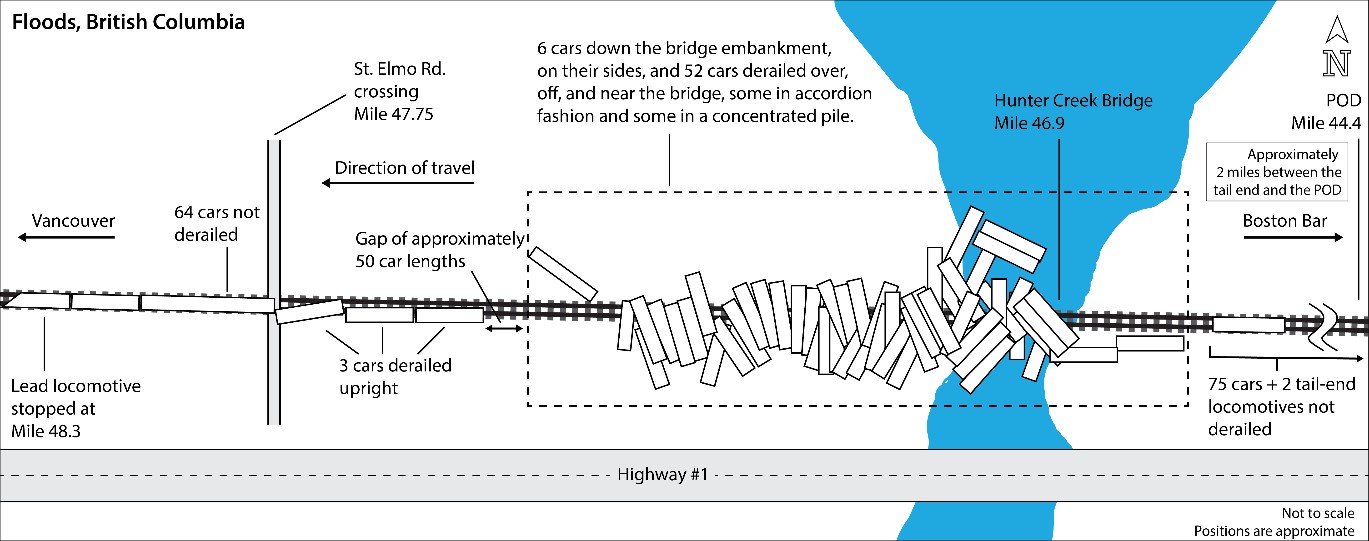
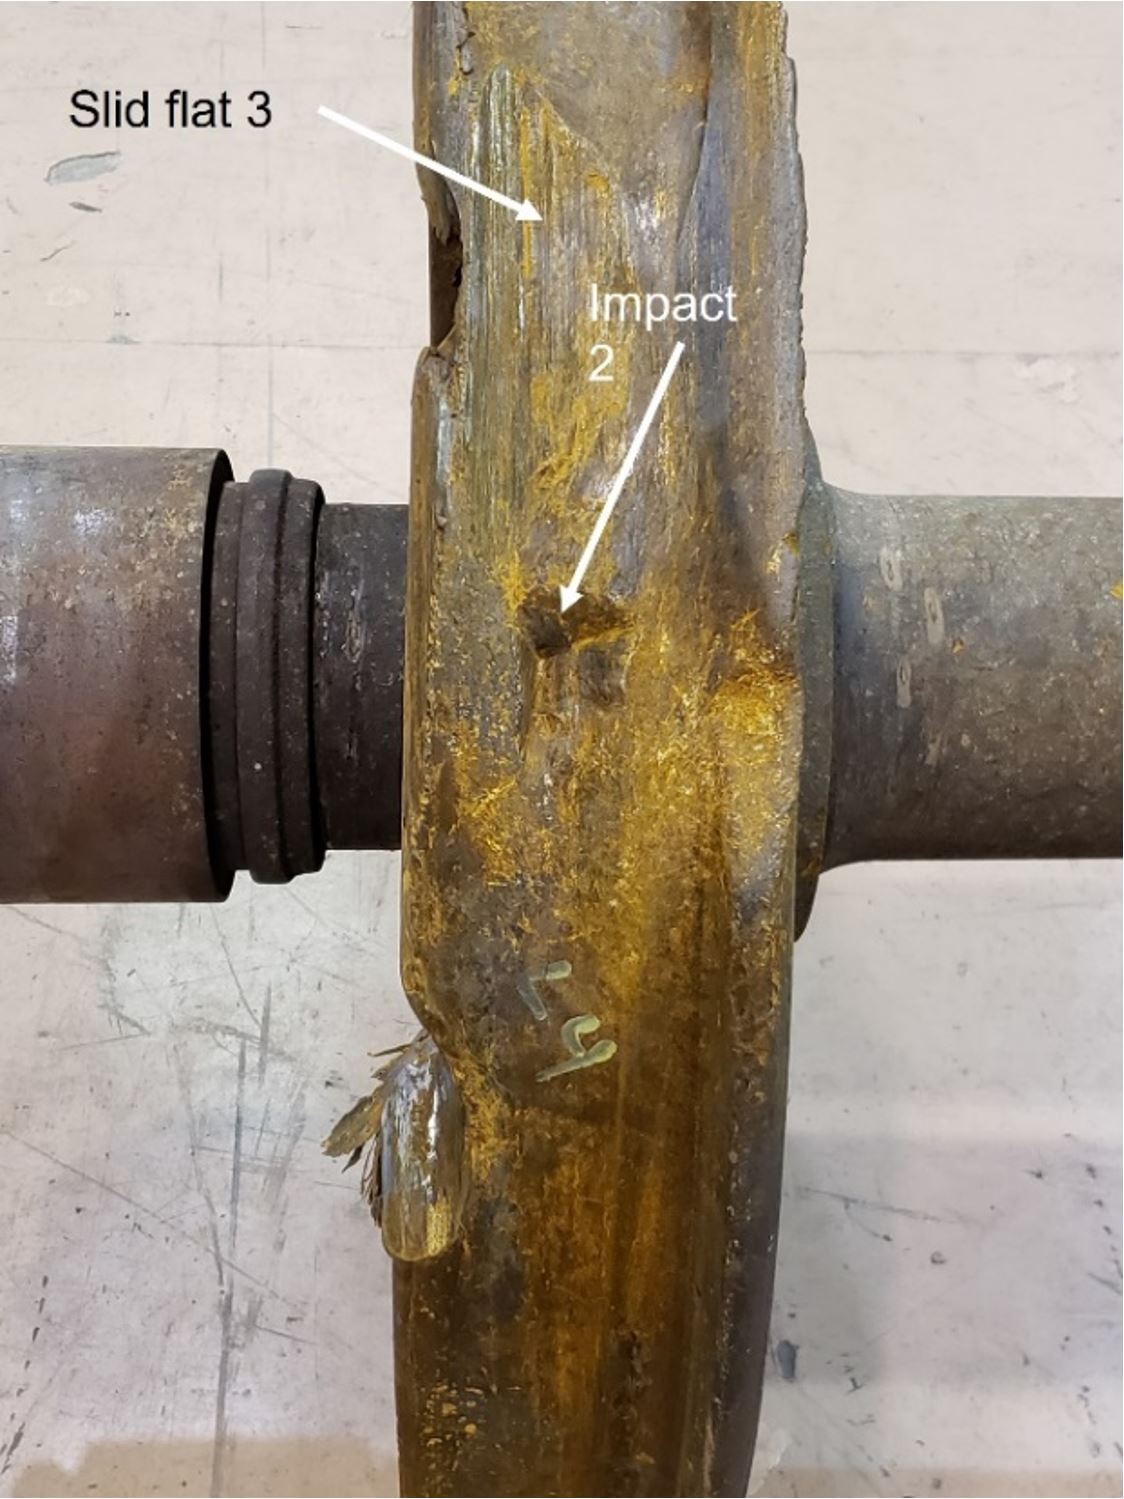
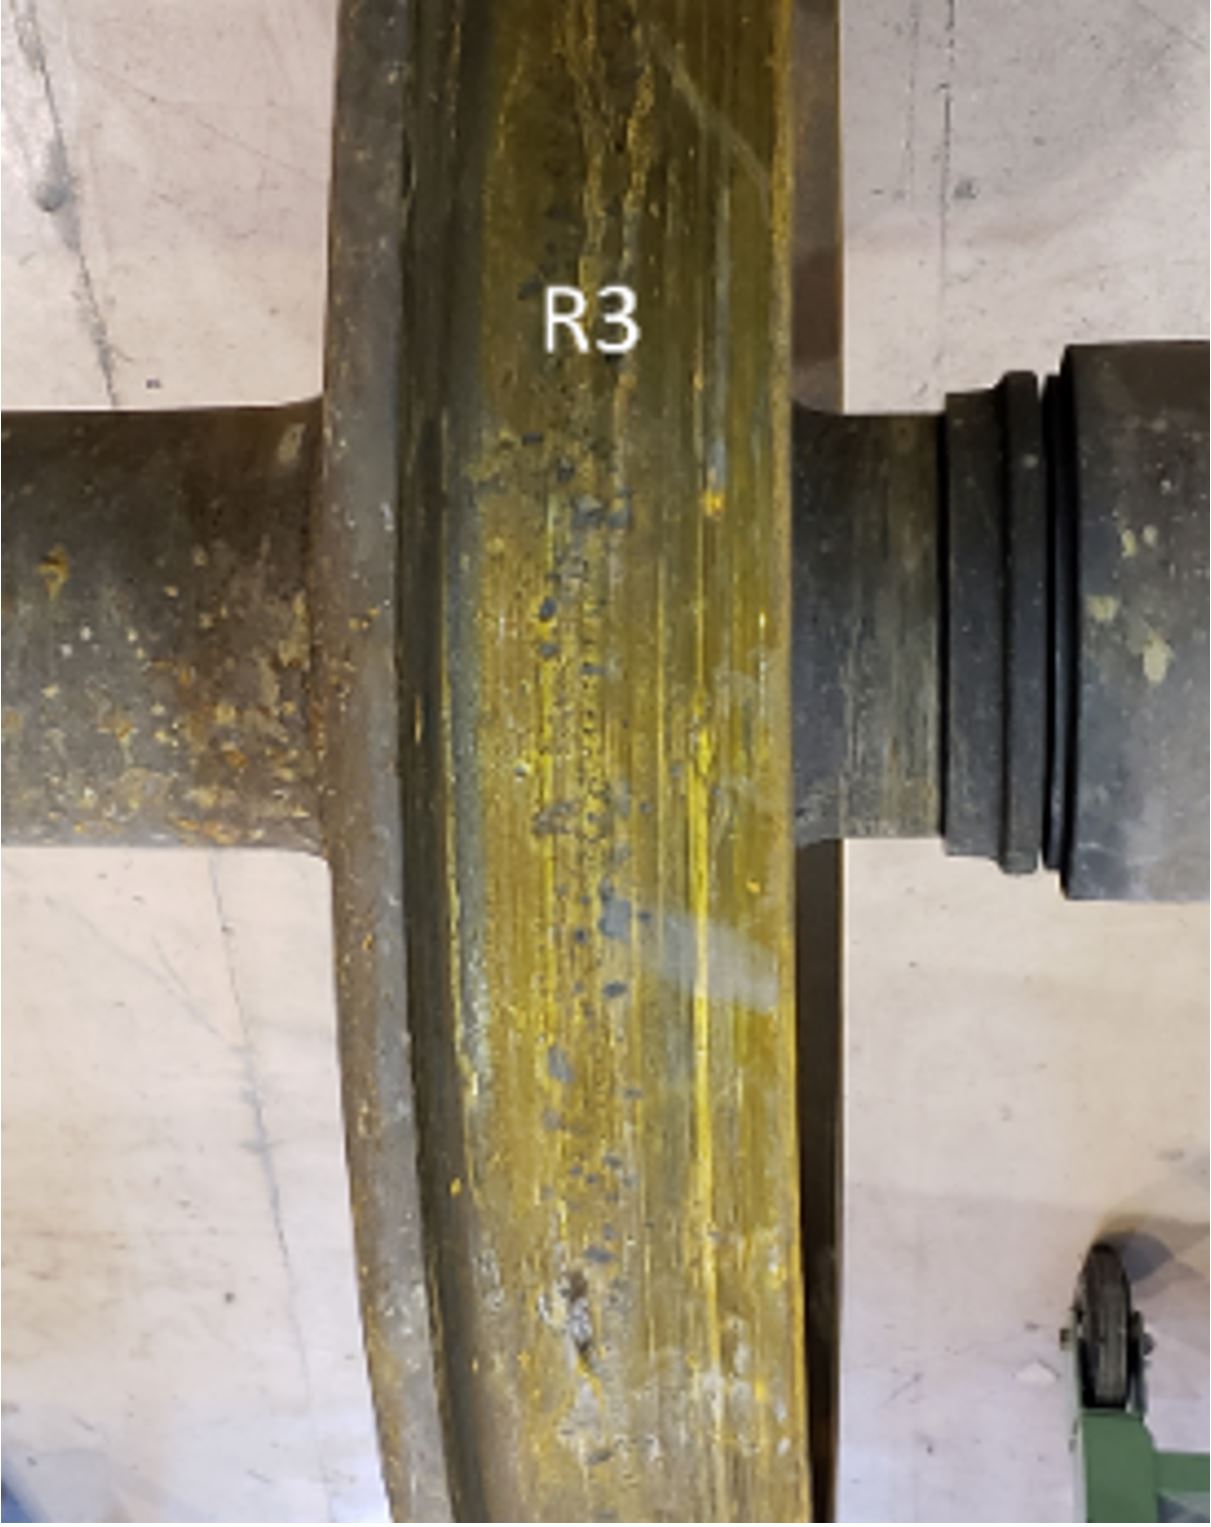
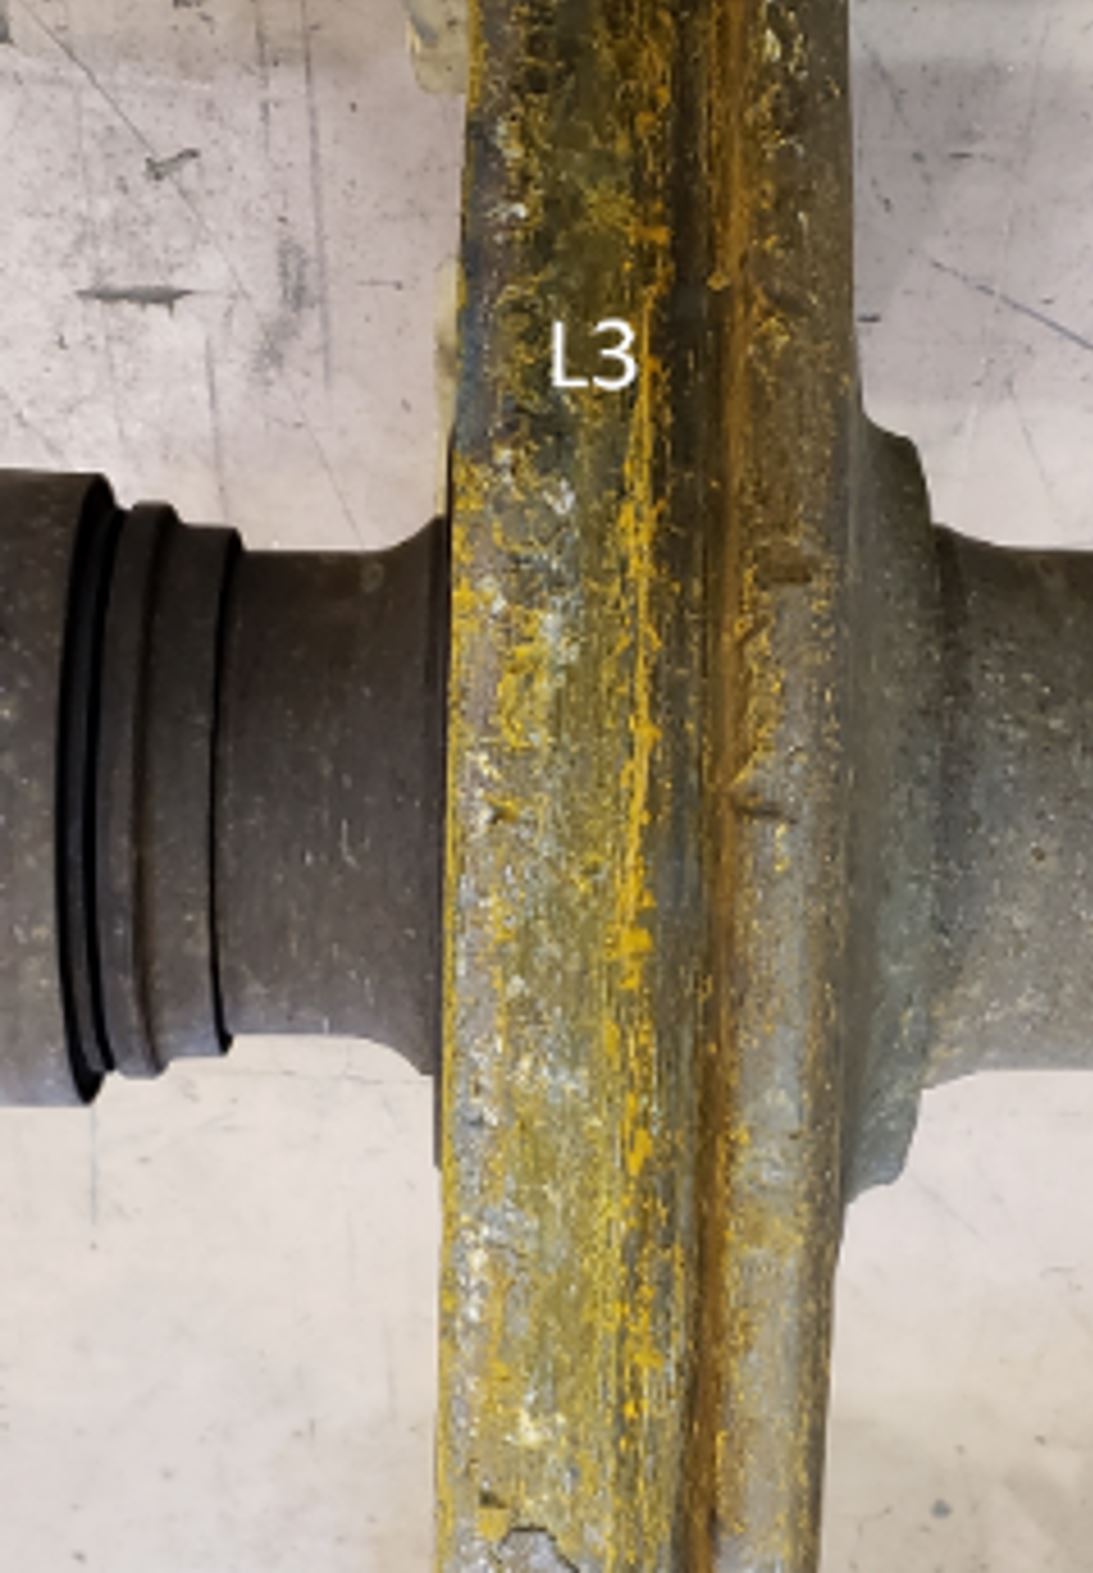
On the A-end truck of this car, the first and second wheels on the left side of the truck in the direction of travel, L4 and L3 respectively, were found derailed inside the track gauge to the south. Figures 3 and 4, respectively, show the derailed L3 and the L4 wheels. The R4 and R3 wheels on the right side of the truck remained on the running surface of the north rail. The trailing truck (L2/R2 and L1/R1 wheel sets) was still on the rails.
Both wheel sets were extensively damaged; the L4 wheel exhibited severe slid flatsFootnote 10 at multiple locations and 2 distinct gouges across the wheel tread surface. The L3 wheel was missing 1.75 inches of rim width from the outboard rim face of its entire circumference (Figure 3). The 2 wheel sets were recovered from the wreckage and sent to the TSB Engineering Laboratory in Ottawa, Ontario, for further examination and analysis.
The hand brake was found in the released position when TSB investigators examined the car. The hand brake had been inspected by the conductor immediately after the derailment, and subsequently by other railway personnel who later responded to the derailment. The car’s hand brake components showed no anomalies on preliminary examination, but they were also sent to the TSB Engineering Laboratory for further examination and testing.
1.2.2 Examination of the track
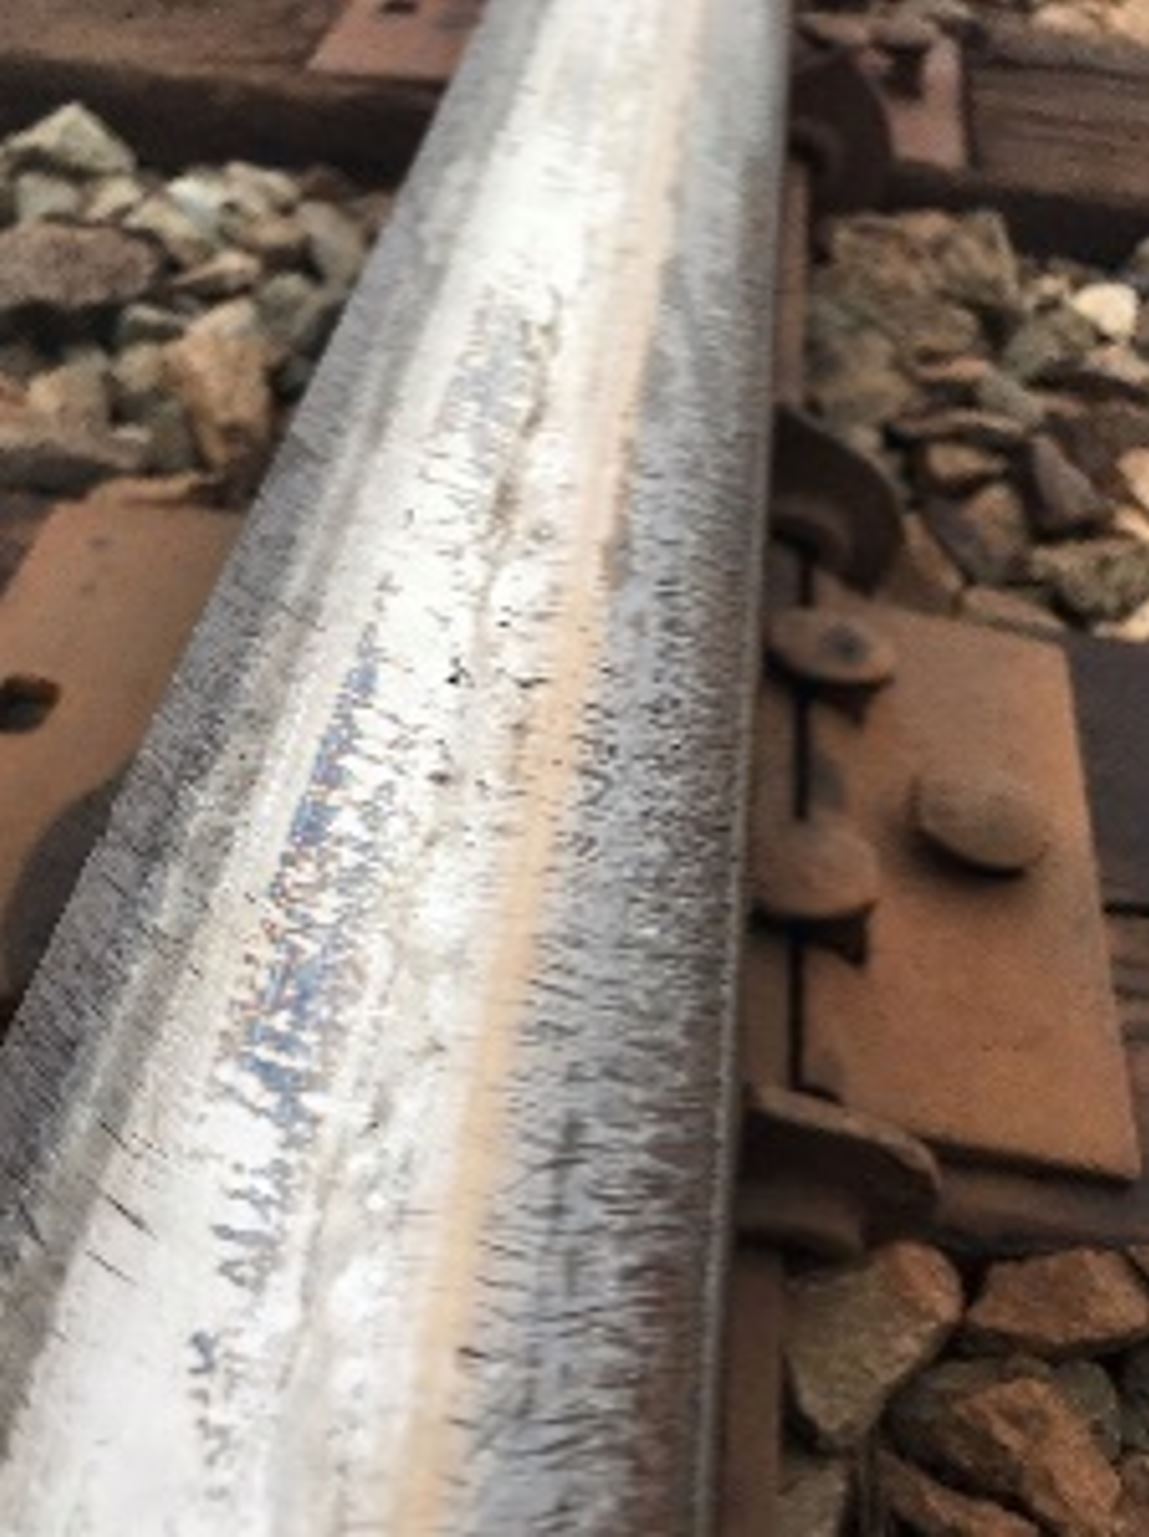
From Mile 39.0 to Mile 40.0, and from Mile 42.3 to Mile 43.9, there was intermittent blueingFootnote 11 on the north and south rail heads, but predominantly on the south rail, which suggests that one or more railcar wheels were not rotating freely on the running surface of the rails in this area (Figure 5).
These observations were made 2 days after the derailment. Sections of rail with blueing were observed under parked CN train 113, which had also been proceeding westward along the Yale Subdivision at the time of the derailment but was required to stop and remained stationary due to the impassable track ahead. Because of the parked train, the track from Mile 40.0 to Mile 42.3 was not inspected.
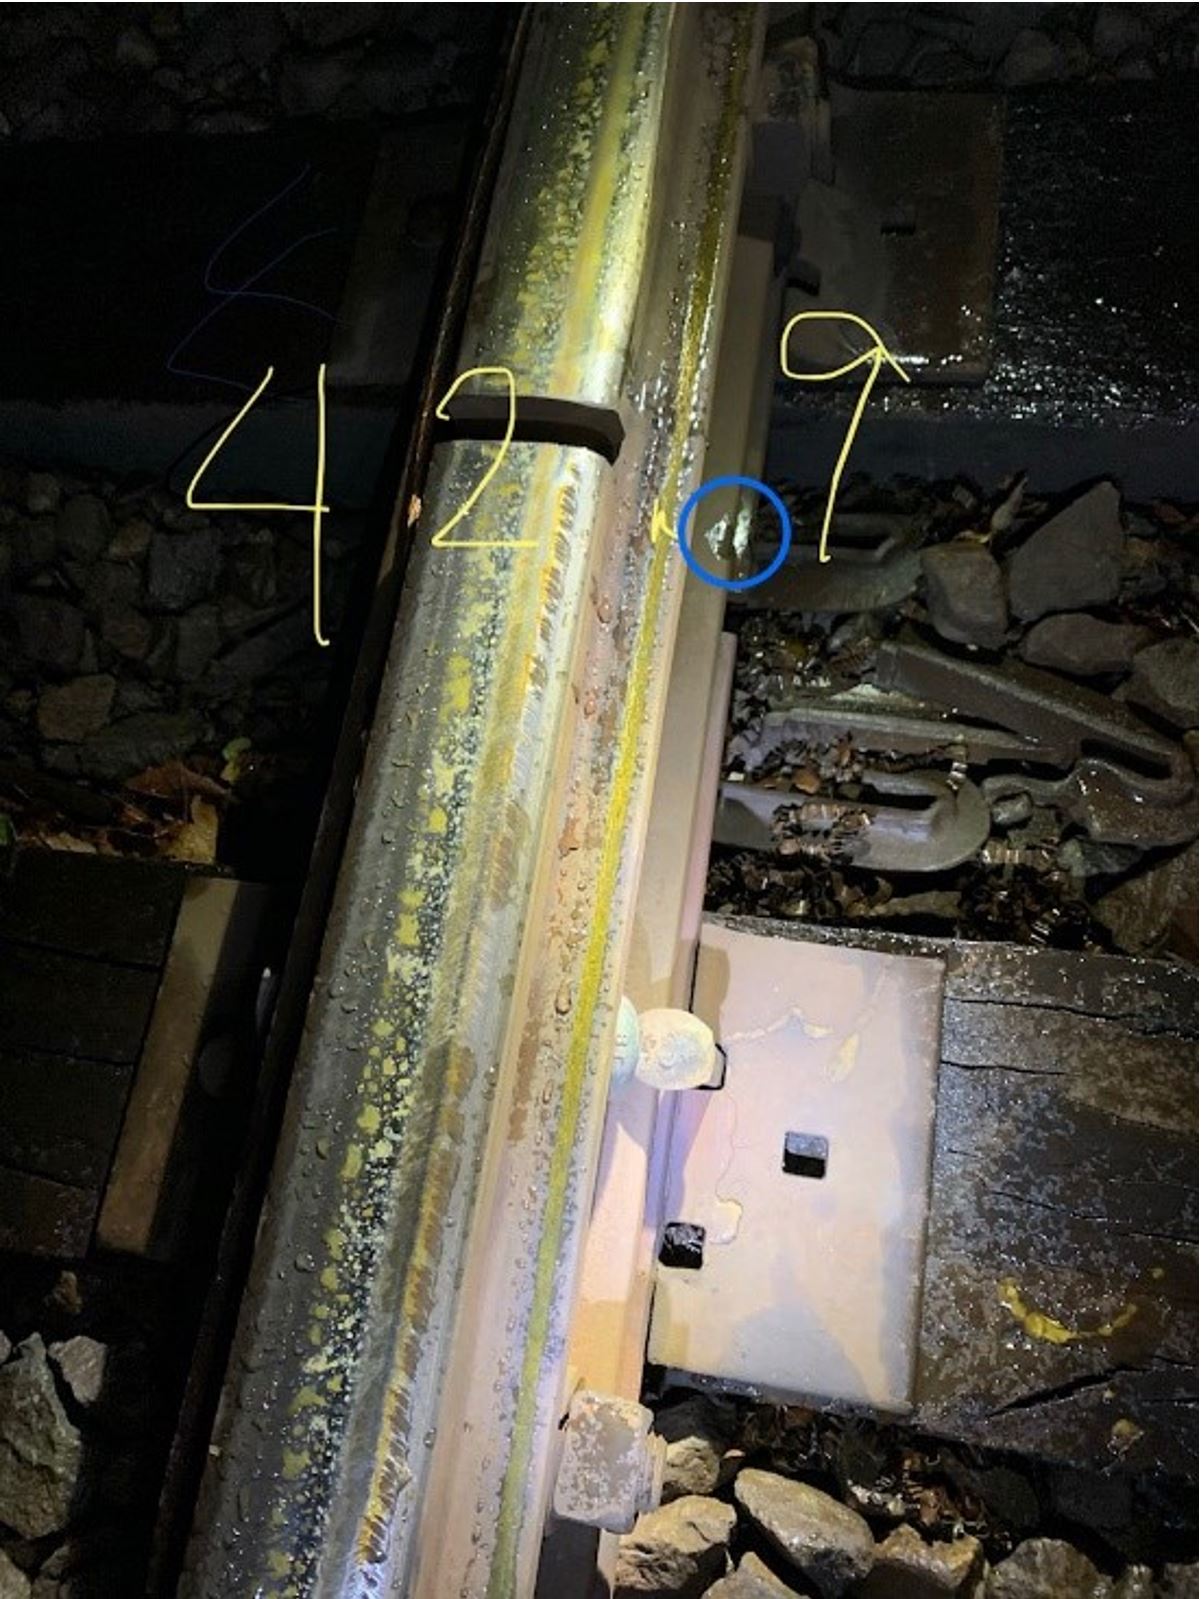
At Mile 42.9, there were rail anchors on the side of the track and there were steel shavings on the gauge side of the rail.Footnote 12 A pre-existing impact mark was evident on the gauge side of the joint bar and there was also a shiny mark on the base of the rail (Figure 6).
No track damage was observed from Mile 42.9 to Mile 44.4.
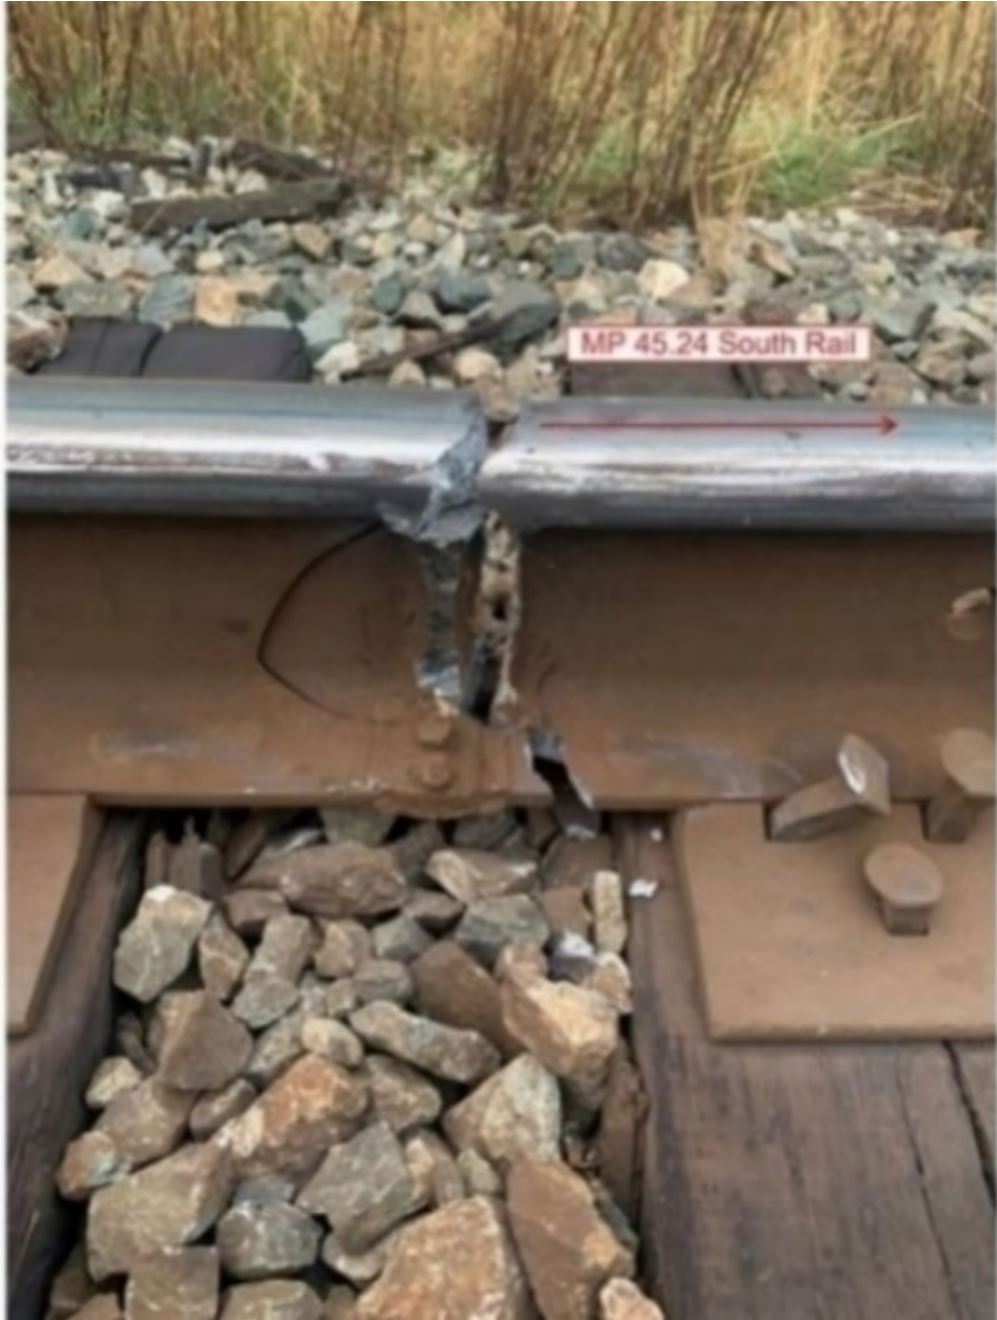
A few ties east of Mile 44.4, the first mark on the top of the south rail was noted (Figure 7); in this area, the track is aligned with a 1.23° right-hand curve that extends from Mile 44.34 to Mile 44.49. At Mile 44.4, the top of the insulated joint bar was sheared off, and bolts and anchors were missing (Figure 8). In addition, there was evidence of lateral movement of the south rail, and the gauge face had the appearance of a machined surface,Footnote 13 suggesting that a car wheel dropped into the gauge at that location. All of this is consistent with this location being the initial POD.
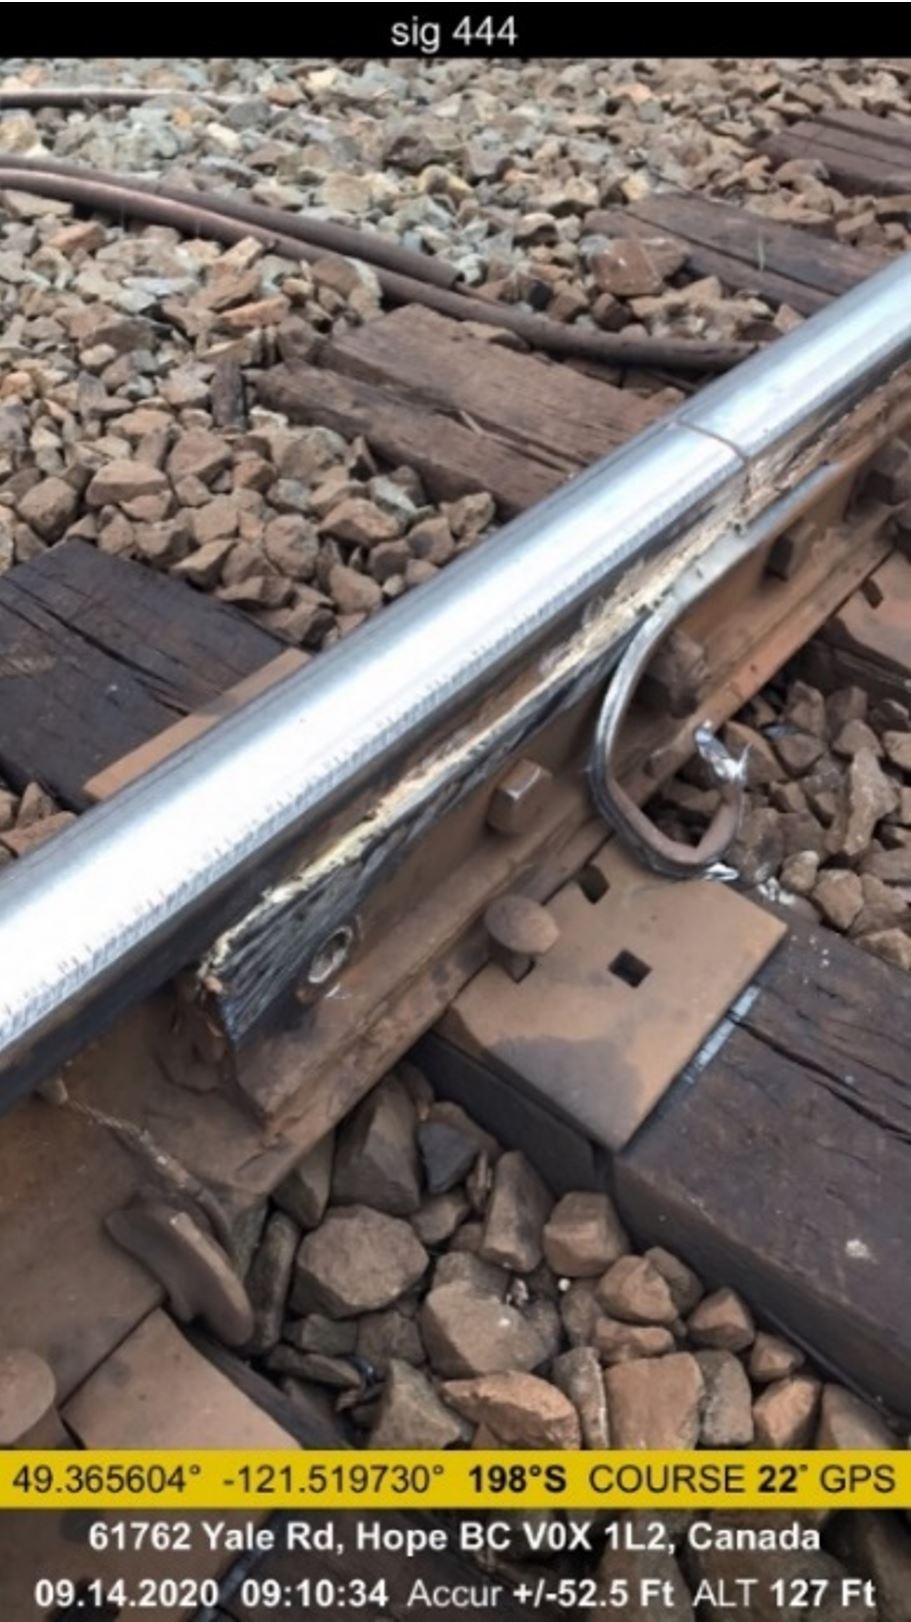
After Mile 44.4, track damage continued westward, including a sheared-off insulated joint bar at Mile 45.8, and missing bolts and anchors. There were 4 distinct rail breaks (miles 45.24, 46.14, 46.5, and 46.7). Nine fragments of fractured rail recovered from these 4 distinct locations, determined to be fragments from the south rail, were sent to the TSB Engineering Laboratory for examination.
The following were observed regarding the rail breaks at these 4 locations:
- On a piece of rail from Mile 45.24, the web and base were broken (Figure 9).
- On a piece of rail from Mile 46.7 (the closest to the main pile-up over the Hunter Creek Bridge), there were about 4 to 6 inches of fracture at the rail head, web, and base (Figure 10).

1.3 Subdivision information
The Yale Subdivision, part of CN’s transcontinental main line, consists of single and double main-track running east to west from Mile 0.0 at Boston Bar to Mile 112.8 at Douglas Island. Train traffic is governed by the centralized traffic control system, in accordance with the Canadian Rail Operating Rules. All movements are dispatched by a CN rail traffic controller located in Edmonton, Alberta. Rail traffic on this corridor consists of about 25 to 30 freight trains per day, for a total annual tonnage of about 127 million gross ton-miles per mile.
CN and CP operate parallel transcontinental routes through the Thompson and Fraser River canyons between Kamloops and Vancouver. The 2 railways entered into a bidirectional running agreement in 1999 on this high-traffic corridor. Under the agreement, loaded CN and CP trains travel westward on CN’s track, taking advantage of the flatter grades, while lighter and empty trains travel eastward on CP’s track. This agreement increases the network capacity and reduces locomotive power requirements for both railways.
The directional running zone was fully implemented in mid-2001. On the CN track, it extends 156 miles from Coho (Mile 57.2 of the Ashcroft Subdivision) to Matsqui Junction (Mile 87.9 of the Yale Subdivision). On the CP track, it extends 153.7 miles from Nepa (Mile 54.8 of the Thompson Subdivision) to Mission Junction (Mile 87.0 of the Cascade Subdivision). The majority of traffic through the directional running zone consists of freight trains.
In accordance with this agreement, the occurrence train was operated by a CP crew to Boston Bar, where it was delivered to CN for operation westward on CN’s Yale Subdivision.
Once the CP train was accepted at interchange by CN, crewed with a CN crew, and given a CN train designation, it became a CN train while operating on CN track. Similarly, CN trains accepted and operated on CP track are considered CP trains.
1.4 Track information
The track on the Yale Subdivision is Class 4 track under the Rules Respecting Track Safety, also known as the Track Safety Rules (TSR). In the area of the derailment, the maximum allowable speed is 55 mph for all trains.
The track in the vicinity of the POD was mostly tangent and consisted of 136-pound continuous welded rail manufactured by Nippon Steel; the north rail was manufactured in 2006 and the south rail in 2018. The rails were laid on 14-inch double-shouldered tie plates and fastened with 4 spikes per plate on wood ties in good condition between Mile 41.6 and Mile 45.3, after which point the track transitioned to concrete ties. The rail, which was within established wear limits, was box-anchored every tie. The ballast was crushed rock in good condition. The subgrade and drainage were adequate in the vicinity of the occurrence.
1.4.1 Track inspection and maintenance
The TSR outline the minimum maintenance standards and the related track inspection requirements. In addition to the TSR, CN has its own Engineering Track Standards, and these meet or exceed the TSR requirements. In the area of the derailment, track inspections had been carried out in compliance with the TSR and company standards.
The rail had been tested for internal flaws 11 times in 2020 before the derailment. Before the occurrence, the most recent test was conducted on 19 August 2020, with no defect detected in the area of the POD.
The most recent track geometry test was conducted on 15 June 2020; an inspection using a gauge restraint measuring system was also performed on that day. No defects were detected in the area of the POD.
The most recent visual inspection was done on 13 September 2020 by a qualified CN inspector. No defects were found.
Table 1 shows the maintenance performed near the POD in 2020.
| Date | Mile | Details |
|---|---|---|
| 2020-03-01 | 44.45 | A 17-foot plug rail was installed in the right-hand curve. |
| 2020-04-01 | 44.35 | The west turnout at Floods was ground. |
| 2020-04-06 | 44.30 | A 13.8-foot plug rail was installed. |
| 2020-07-01 | 44.30 | Switch ties were installed in the west turnout at Floods. |
| 2020-07-19 | 42.90 | Gauging was conducted on 10 feet of the Floods east spring frog guard rail. |
| 2020-07-22 | 44.30 | A plug rail was welded into the track. |
| 2020-08-03 | 44.31 | A joint bar was replaced. |
| 2020-09-02 | 44.51 | A 23.6-foot plug rail was installed (due to a defective rail). |
| 2020-09-02 | 42.82 | A 24-foot plug rail was installed. |
1.4.2 Rail lubrication
Between Boston Bar and Mile 47.2, there were 38 rail lubricators. Rail lubricators are devices used to apply lubricant between the wheel and rail and are positioned near curves, where lubrication can extend rail life by reducing friction between wheels and rails. Visual inspection of these lubricators during regular inspections by hi-rail vehicle indicated that the lubricators were working.Footnote 14
Detailed lubricator inspections by a track maintenance employee, who stops and inspects the units, were conducted on 07 and 08 September 2020. Four lubricators were found to be non-operational. The non-operational lubricators were located at miles 8.3, 14.2, 39.2, and 47.2. It is unknown if they were restored to operational service by 14 September 2020.
Based on the number of working lubricators and on the inspection results provided by CN, it was determined that the rail was adequately, but not excessively, lubricated on the day of the occurrence.
1.5 Railcar wheel temperature
On a freight train, railcar brake systems use air brakes or hand brakes to press brake shoes against the wheel treads which slows or stops the train due to brake shoe friction. The friction produces heat and, if the brakes are applied for an extended period, the heat can migrate from the tread surface into the wheels. High-friction composition brake shoes are designed to withstand temperatures up to about 500 °F but rapidly deteriorate at higher temperatures.Footnote 15 Excessive heating of railcar wheels can also cause thermal damage to the wheels, making them more prone to wear and failure. The longer a wheel is exposed to elevated temperatures, the greater the risk of damage.
For a definition of thermal damage and other terms related to wheel metallurgy, see Appendix A.
1.5.1 Wheel temperature measurement
Major railways in North America use strategically positioned electronic wayside detectors to inspect the condition of rolling stock while en route. The detectors are designed to provide early detection of potential safety concerns by monitoring for such things as wheel impact loads, dragging equipment, wheel bearing temperature, and wheel temperature.
Wheel temperature data are measured and recorded by WTDs. Railways use this data to compare the temperature for each wheel on a car to the overall average wheel temperature for all cars on the train, which can then be used to detect a variety of brake-related problems.
Wheels that do not contribute to the car’s braking effort remain cold when the brakes are applied; cold wheels are therefore an indication of reduced brake efficiency. Conversely, wheels that have elevated temperature readings when the brakes are not applied are considered warm or hot (depending on the actual temperature measured) and are usually indicative of a brake issue, such as a stuck air brake, a hand brake that is not released, or a brake cylinder pressure retaining valve that is not in the release position.
Railways set their own thresholds for determining whether a wheel is considered cold, warm, or hot, and provide their own guidelines on how to respond to each of these conditions.
Scanned wheel temperatures are matched to specific car numbers and stored digitally in a database. The temperature readings and any alerts from WTDs are also displayed on a detector operator’s screen at the mechanical desk in the rail traffic control centre, enabling the railway company to monitor the situation and take appropriate action.
WTDs do not report the actual temperature at a single point on a wheel; rather, they report a computed average value from multiple temperature readings taken at different points on the wheel, including the flange, rim, and plate, but not the tread (Appendix B). Previous studies show that the tread temperature can be estimated at 150 °F hotter than the wheel temperature reported by the detector. Footnote 16 The various temperature alarm thresholds established by a railway take this into account when initiating corrective actions.
1.5.2 Thermal stress on freight car wheels
Railcar wheels in freight service are made of material which meets the Association of American Railroads (AAR) Specification M-107/M-208 for Class C wheels.Footnote 17 These wheels are designed with a relatively high carbon content (0.67% to 0.77%), which increases the material strength of the wheels and reduces the normal wear rate. High carbon content, however, makes the steel more sensitive to high thermal stress. Yield strengthFootnote 18 starts decreasing at temperatures above 100 °F but remains relatively high until the temperature reaches 400 °F. A more appreciable reduction in yield strength occurs in the 400 °F to 800 °F range; above 800 °F, it decreases very rapidly (Figure 11). A large reduction in yield strength results in wheel fatigue.Footnote 19
![Relationship between wheel temperature and yield strength of the metal (Source: C. Lonsdale, Railroad Wheel Design Considerations, Service Defects and Failure Modes, presented at the Wheel Rail Interaction Conference [Rosemont, Illinois, May 2012], modified by the TSB for clarity)](/sites/default/files/eng/rapports-reports/rail/2020/r20v0185/images/r20v0185-figure-11.jpg)
In normal train operations, the highest temperatures to which wheels are exposed occur when brakes are applied for an extended period to control train speed on a long descending grade. In Canadian operations, the steepest and longest grades are on CP’s Laggan and Mountain subdivisions where brake applications of about 10 psi brake pipe pressure reduction are held for about 1 hour.
The amount of heat generated during sustained braking is proportional to brake horsepower (BHP). Footnote 20 Class C wheels with a 36-inch diameter, such as the wheels on potash freight trains, are designed to withstand sustained braking loads up to 30 BHP per wheel, which would typically result in a WTD temperature reading in the 200 °F to 300 °F range. Footnote 21 Although wheels can generally withstand BHP significantly above 30 for short durations, the longer a wheel’s thermal capacity is exceeded, the greater the risk of damage. The maximum authorized speed while descending a steep grade is typically set at 20 mph, to ensure that BHP remains within a safe range under these conditions.
In a previous investigation, the TSB obtained the wheel temperatures recorded by a WTD at Mile 111.7 of the CP Mountain Subdivision for a loaded potash train;Footnote 22 the WTD is at the bottom of a 2.2% grade. The average temperature for the wheels on the train after the brakes were applied (10 psi brake pipe pressure reduction) for about 1 hour, at a speed of no more than 20 mph (the maximum authorized speed on this grade), was 210 °F (Figure 12).

Wheels can also be exposed to high thermal stress in abnormal operating conditions on a moving car, such as a stuck brake or a hand brake inadvertently left applied. The investigation reviewed the WTD readings for 3 exemplar trains that had been stopped due to indications of warm wheels and, upon inspection, were found to have had a hand brake applied on a railcar. The warmest recorded temperatures for each car ranged between about 200 °F and 400 °F.Footnote 23
To gain insight into the thermal stresses on the wheels of car CNPX 3373 in this occurrence, the investigation calculated the BHP throughout the trip based on the known temperature of the L3 wheel at Komo (544 °F), the known speed of the train, and an estimated brake retarding force. The results indicate that BHP averaged 50 for the first leg of the trip between Boston Bar and Komo and reached a maximum of 81 around Komo, well in excess of the 30 BHP that 36-inch diameter Class C wheels are designed to withstand. The BHP remained high throughout the trip (1 hour and 46 minutes), with an overall average of 45. The calculated average brake retarding force was 752 pounds between Boston Bar and the location of the train-initiated emergency brake application and, based on this value, the 30 BHP threshold would have been exceeded while the train was travelling above 15 mph (Appendix C).
1.5.3 Canadian National Railway Company’s hot wheel procedure
At CN, a wheel is considered to have an extreme heat condition (“hot wheel”) if there is a reading of 558 °F or more.
CN’s General Operating Instructions indicate that, when a train crew receives a hot wheel alarm message from a WTD, the train must be brought to a controlled stop and a crew member must proceed to the identified axle and inspect all wheels on the car. If the temperatures of all the wheels appear to be normal, additional inspections must be made on at least 12 axles ahead and behind the identified axle.Footnote 24
1.5.4 Canadian National Railway Company’s Warm Wheel Procedure
CN’s Warm Wheel Procedure describes what to do when a WTD records elevated wheel temperatures on one or more wheels, but below CN’s hot wheel threshold. It states, in part:
Warm Wheels
In WIM [Wheel Information Management System], wheels will pop up when they show a temperature of 300 ° or higher. […] Warm wheels must be acted on if they meet one [of] the following conditions:
- Heat is showing over the majority of detectors the train has gone over on the subdivision
- 2 consecutive detector reading [sic] of 350 ° or more
- A single reading of 400 ° or higher
Procedure
- 1 – Have the crew perform a positive reduction. […]
- 2 – When the reduction has been requested (after the crew has been contacted or you have received confirmation from the Chief or RTC [rail traffic controller]), enter the information in the Access database.
- 3 – If the train goes over 2 consecutive detectors at 150 ° or less, it can be marked as complete and no further action is required. If not, go to step 4. […]
- 4 – If wheel heat does not clear up, the car(s) must be inspected. Have the car(s) inspected at the next crew change or repair terminal, whichever is closer. […]Footnote 25
1.5.5 Canadian Pacific Railway Company’s Warm Wheel Alarm Action Procedure
CP also has a warm wheel procedure. It states, in part:
A first alarm is triggered if wheel temperatures are greater than 350°F and three standard deviations from the train average temperature. These temperatures are lower than what would normally trigger an absolute hot wheel alarm (600 °F). This will initiate a process to induce brake cycling. A second alarm is generated if the elevated temperatures persist in subsequent detectors, requiring the stopping of the train. Train stops offer flexibility to nearby crew change/mechanical accessible locations or yards as compared to absolute alarms which require immediate stops.Footnote 26
The procedure provides an example of a warm wheel alert email for a second alarm; in this example, the stated recommended action is as follows “Stop train where operationally convenient. Train crew to inspect car for applied hand brakes, stuck brakes, slack adjuster and train-line or control valve leakage and report back.”Footnote 27
1.5.6 Wheel temperature readings for car CNPX 3373
On the Yale Subdivision, there were 4 WTD locations east of the derailment site:
- West of Boston Bar (Mile 1.7)
- West of Komo (Mile 13.8)
- West of Yale (Mile 29.2)
- West of Hope (Mile 42.8)
A review of the data obtained from these detectorsFootnote 28 (Table 2) indicated that the only car with elevated wheel temperatures after leaving Boston Bar was car CNPX 3373, which was the first car to derail and was the first car in the second cut to which hand brakes would have been applied during the double-over operation at Boston Bar Yard.
| Axle | Komo (Mile 13.8) | Yale (Mile 29.2) | Hope (Mile 42.8) |
|---|---|---|---|
| 269 | R4 north rail: 214 °F L4 south rail: 321 °F |
R4 north rail: 206 °F L4 south rail: 254 °F |
R4 north rail: 278 °F L4 south rail: 309 °F |
| 270 | R3 north rail: 367 °F L3 south rail: 544 °F |
R3 north rail: 375 °F L3 south rail: 299 °F |
R3 north rail: 254 °F L3 south rail: 291 °F |
| 271 | R2 north rail: 295 °F L2 south rail: 472 °F |
R2 north rail: 343 °F L2 south rail: 371 °F |
R2 north rail: 274 °F L2 south rail: 321 °F |
| 272 | R1 north rail: 295 °F L1 south rail: 538 °F |
R1 north rail: 339 °F L1 south rail: 295 °F |
R1 north rail: 230 °F L1 south rail: 242 °F |
* As the data shows, the wheel temperature for car CNPX 3373 at Komo, Yale, and Hope predominantly read higher for the wheels on the left side of the car (the side travelling on the south rail). The investigation reviewed detector calibration information and determined that the detectors were calibrated in accordance with CN’s Signals and Communications General Instructions, section 501(a) (effective 13 April 2012).
The data recorded by the WTDs at Komo for car CNPX 3373 showed that the wheel temperature exceeded 450 °F on 3 of the left wheels. The reading for the L3 wheel was 544 °F, just below the 558 °F threshold for hot wheels.
The temperature of the wheels on car CNPX 3373 was 300 °F or higher on at least 2 wheels at every detector location. In comparison, the average wheel temperature for the entire train was about 17.5 °F.
In accordance with CN’s Warm Wheel Procedure, which states that action must be taken if there is a single reading of 400 °F or higher, the crew was notified by the rail traffic controller and was required to apply a positive reduction. More specifically, they were directed to apply the air brakes using a 10 psi brake pipe reduction, followed by a release of the brakes. The locomotive engineer made a positive reduction and the train came to a brief stop of 3.5 minutes at Mile 21.2, after which the air brakes were released and the train continued its journey westward.
At Yale, all WTD readings on the same 3 left wheels were lower than at the previous detector, but they were still above 250 °F. According to CN’s procedure, an action taken following a warm wheel reading can be marked as complete only if the car with elevated wheel temperatures goes over 2 consecutive detectors at 150 °F or less. As this was the first detector following the positive reduction, the issue remained open until readings could be obtained at the next detector location.
At Hope, the wheels reduced in temperature further, but the 3 wheels were still above 150 °F, which meant that the temperature was still too high for the issue to be considered resolved. Since the wheel heat had not cleared up after the train passed 2 consecutive detector locations, CN’s procedure required that the car be inspected at the next crew change or repair terminal, whichever was closer. The closest repair terminal was at Chilliwack (Mile 71.8), approximately 29 miles from the WTD at Hope.
A review of the locomotive event recorder data from the lead locomotive indicates that, after departing Boston Bar and until the train-initiated emergency brake application, the train travelled just over 46 miles in about 1 hour and 46 minutes. During this time, train speed exceeded 15 mph for over 1 hour and 30 minutes and reached a maximum speed of 50 mph when the train-initiated emergency brake application occurred (Figure 13). Elevated wheel temperatures on car CNPX 3373 were sustained for the duration of the trip other than the brief 3.5-minute stop at Mile 21.2.
1.6 Laboratory examination of the recovered rail fragments
The TSB laboratory examined the 9 fragments of broken rail recovered during the site examination. The fragments were pieces of the broken south rail from miles 45.24, 46.14, 46.5, and 46.7.
No gross plastic deformation was observed on the head or gauge side of the rail fragments. There were no indications of progressive failure or pre-existing cracks. There was no evidence of impact on the running surface of the rail head at any of the fracture locations.
It was determined that, in all cases, the fractures were located at thermite welds and were brittle in nature, which indicates that the rails did not have pre-existing defects.
The fractures were all consistent with lateral force applied to the gauge side of the rail and were attributed to lateral gauge movement from a wheel dropping into gauge.Footnote 29
1.7 Laboratory examination of the recovered wheel sets on car CNPX 3373
The TSB laboratory examined the recovered wheel sets from car CNPX 3373 (L4/R4 and L3/R3) to help determine the wheels’ modes of failure and the factors that may have played a role in the derailment. The L4/R4 wheel set was leading in the direction of travel and was immediately ahead of the L3/R3 wheel set.
The wheel bearings on both wheel sets were determined to be in serviceable condition.
The 2 wheel sets showed evidence of having sustained significant damage before derailing.
1.7.1 Wheel information
All of the wheels examined were 36-inch, heat-treated, curve-plated Class C wheels.
The L4/R4 wheels were manufactured by Griffin Wheel Company and assembled in 2013. The wheel set had never been reconditioned.
The L3/R3 wheels were manufactured by Standard Steel and assembled in 2008. The wheel set was last reconditioned in April 2011 at Greenbrier Rail Services in Elizabethtown, Kentucky, United States (U.S.), at which time it also underwent ultrasonic testing.
CP provided data from wheel impact load detectors (WILDs)Footnote 30 for these wheels; a review of the data did not show any recent notable impact loads for any wheel on car CNPX 3373, which indicates that the wheels did not have pre-existing shellsFootnote 31 or spalls.Footnote 32
The day before the occurrence, the train had travelled on CP’s Shuswap and Thompson subdivisions, en route to Boston Bar. Car CNPX 3373 had not raised any wheel temperature alarms while travelling on these subdivisions.
1.7.2 R4 wheel
The following damage was observed on the R4 wheel (Figure 14):
- There were 3 slid flat spots, ranging in size from 8 to 14 inches.
- Two of the 3 slid flats had abrasion, reducing the wheel’s flange thickness to less than 1 inch at the thinnest.
- Displaced material was observed at the trailing edge of the slid flats.
- There was evidence of blueing, masked by rust.
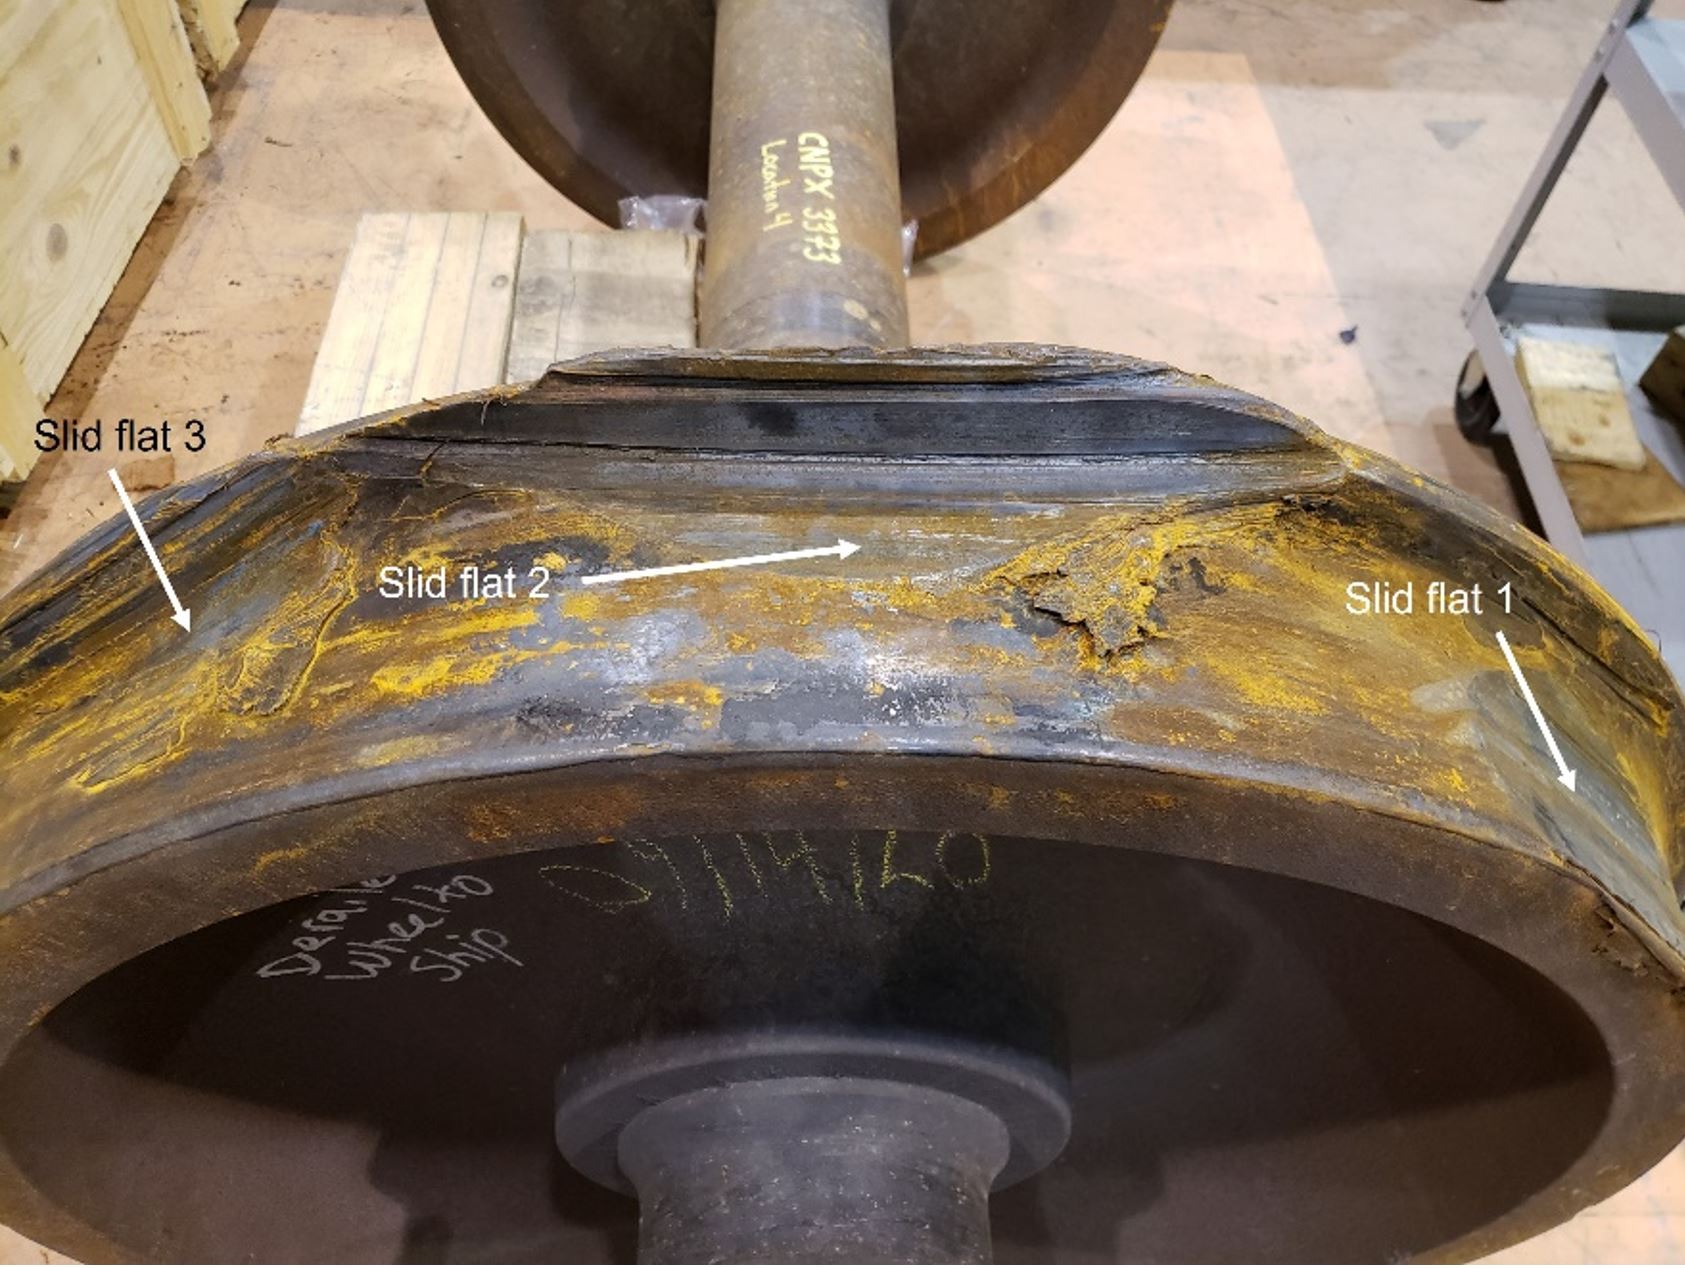
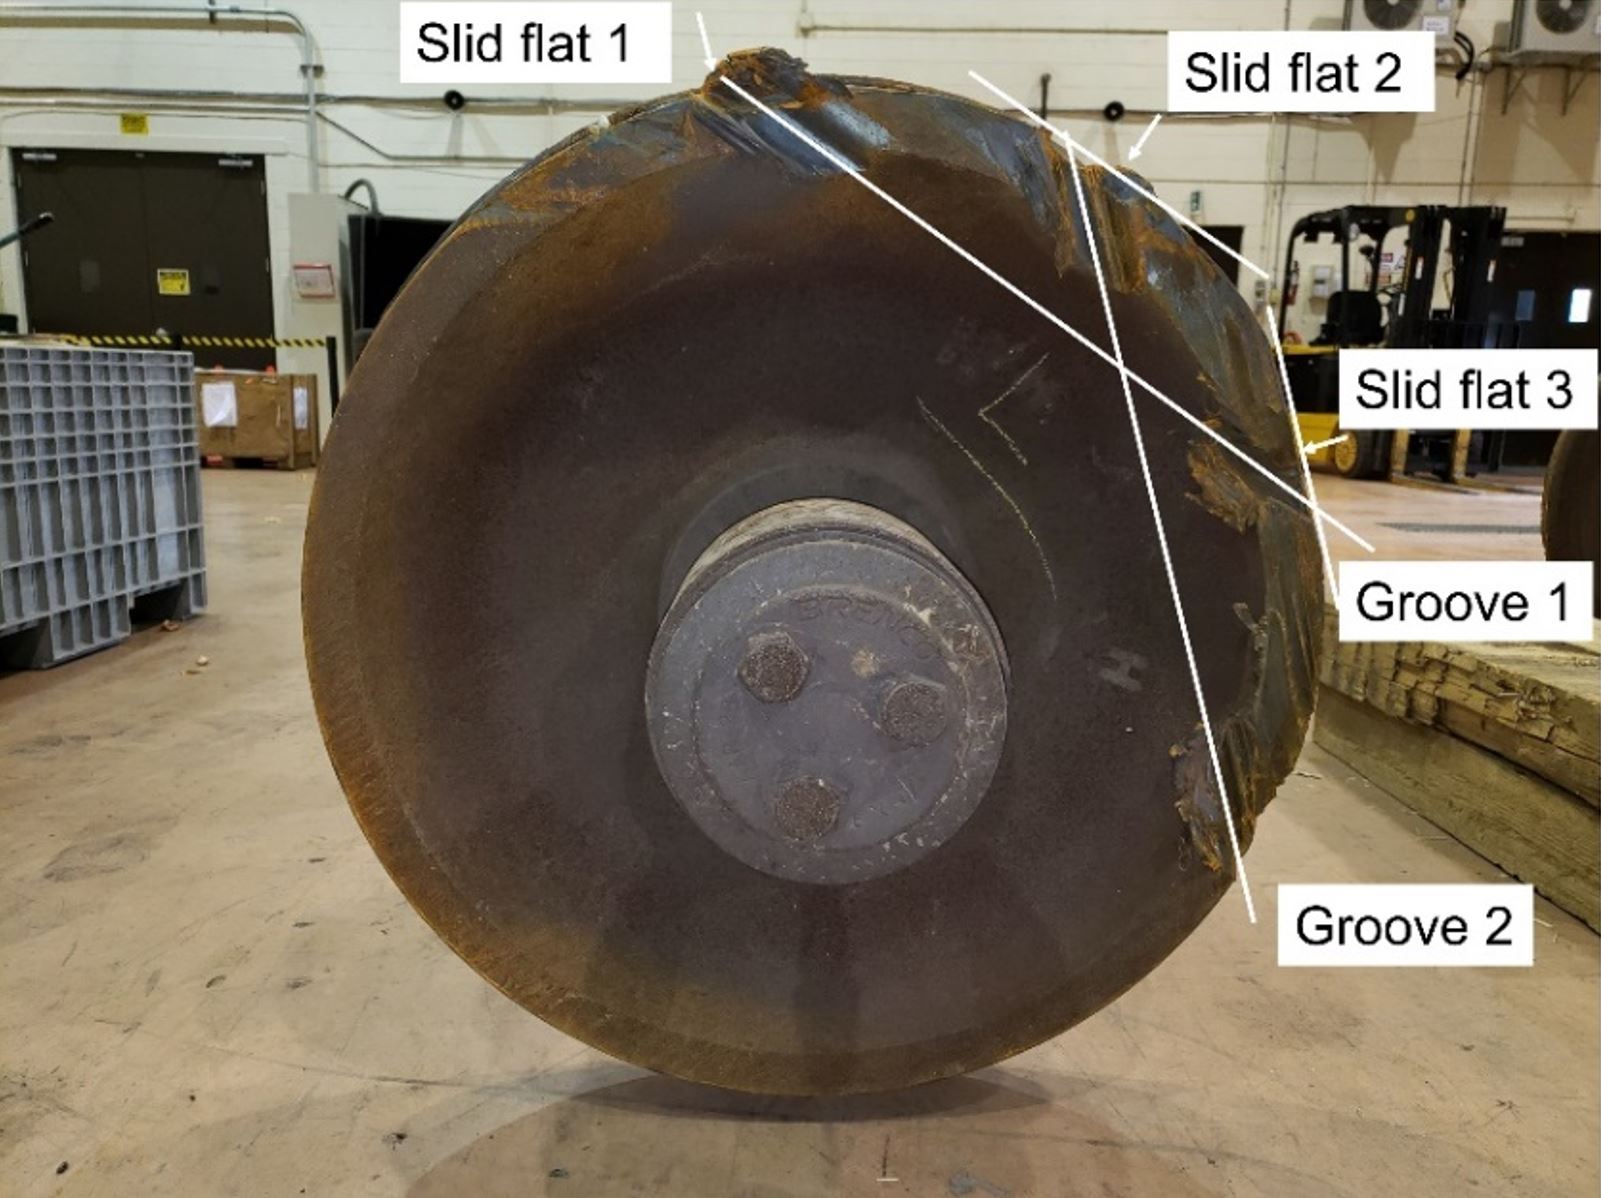
1.7.3 L4 wheel
The following damage was observed on the L4 wheel (Figure 15):
- There were 3 slid flat spots, ranging in size from 8 to 14 inches.
- The wheel had sustained 2 secondary impacts:
- The first impact had created a dent in the tread that was approximately 1 inch deep and 10 inches long; it had obliterated 1 of the slid flats.
- The second impact had created a dent in the tread that was approximately 0.5 inches deep and 2.25 inches long.
- There were 2 grooves in the outboard rim.
- The flange was worn down in the slid flat 2 and slid flat 3 locations.
- The tread had material buildup.
Figures 16 and 17 provide a close-up of the slid flats and impact locations.

The slid flats to the L4 wheel were consistent with the wheel set stopping to rotate and then skidding on top of the rail over a distance. The 2 grooves were consistent with the wheel gradually dropping into gauge and rubbing against the rail head while the wheel set was not rotating. Figure 18 shows a close-up of the second groove.
1.7.4 R3 wheel
The R3 wheel had dents of varied size around the entire circumference, but concentrated on the portion of the tread that contacts the rail head (Figure 19). These dents were consistent with the wheel having been subjected to impact with debris from the R4 wheel.
1.7.5 L3 wheel
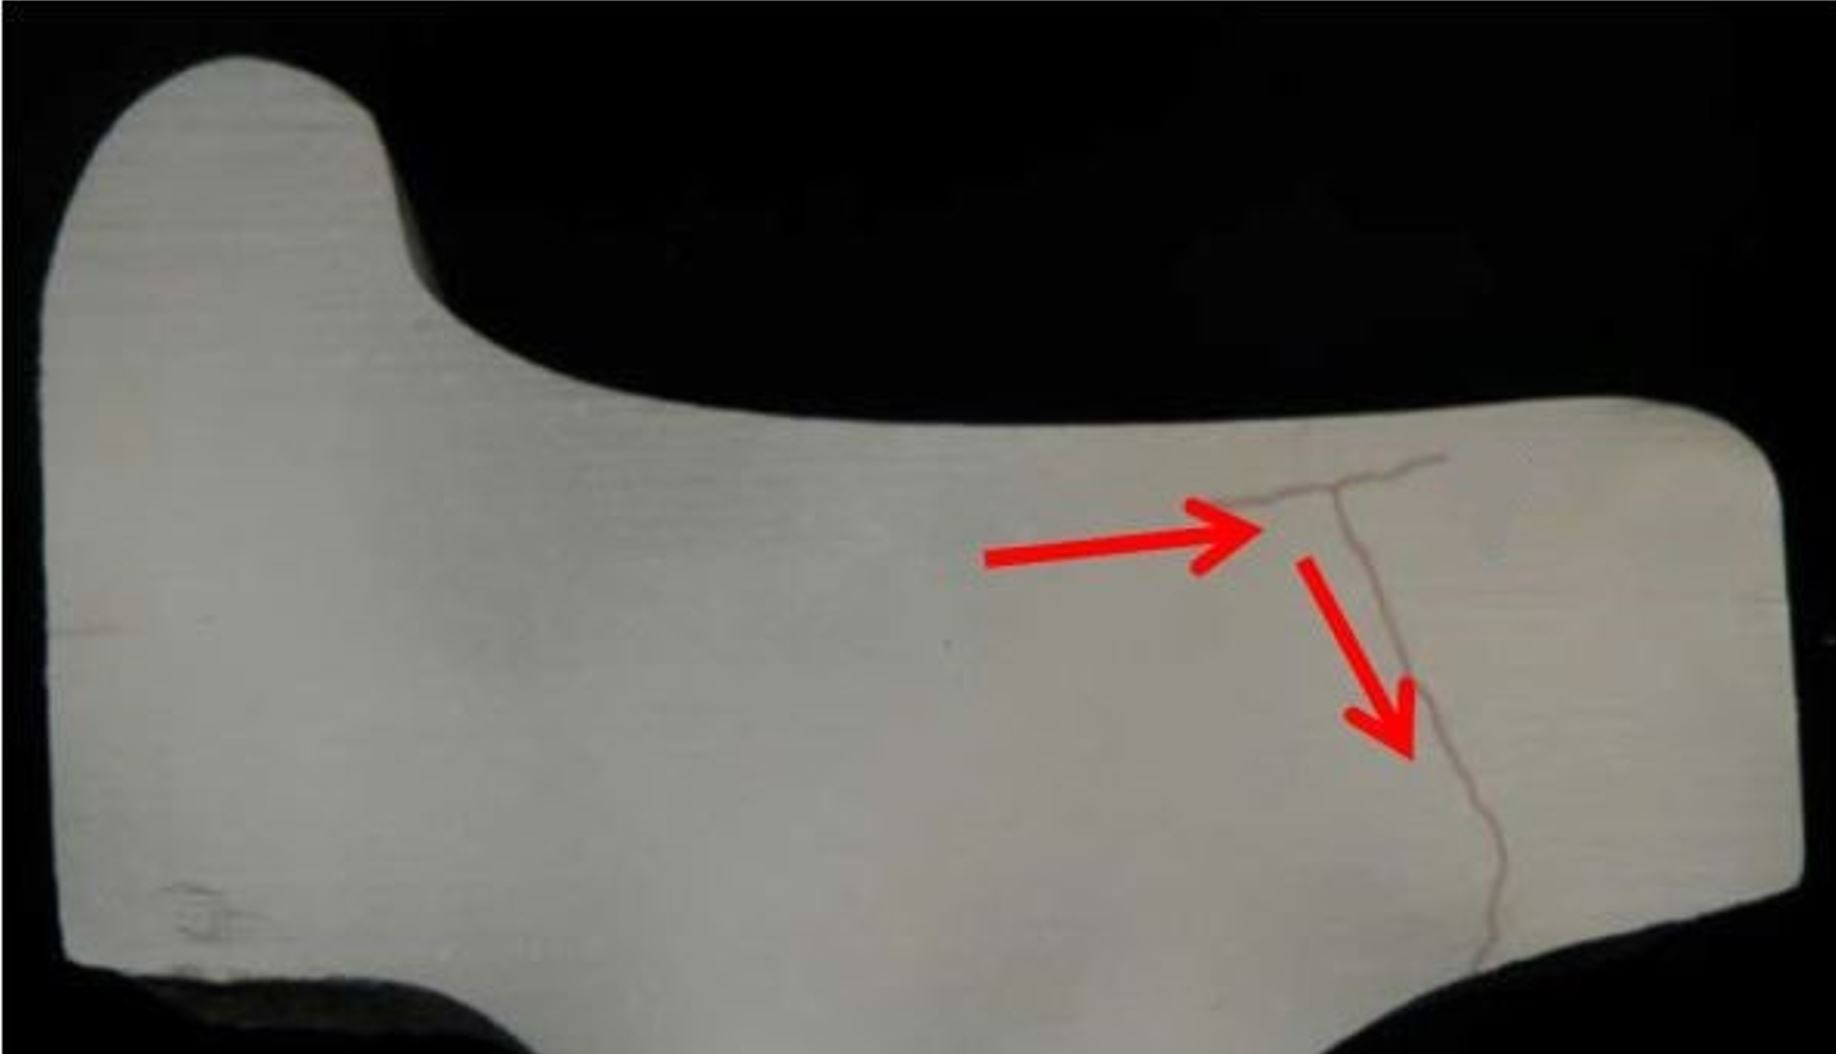
The following damage was observed on the L3 wheel (Figure 20):
- The wheel had lost approximately 1.75 inches of rim width from the outboard rim face.
- The rim face was uniformly ground.
- The pattern on the outer rim was consistent with continuous contact with the gauge side of the rail head while rotating.
- The tread had material buildup, which was consistent with the material displaced from the outboard rim as a result of the observed wear.
- The built-up material on the wheel was flattened, which was consistent with the wheel running on the rail base rather than the rail head.
- There were dents in the flange, consistent with the wheel having run over rail spikes.
This damage indicates that the wheel dropped into gauge.
1.8 Wear of the brake shoes on car CNPX 3373
On 11 September 2020, car CNPX 3373 had travelled on the CP Maple Creek Subdivision, where it passed a train inspection portal system at Mile 85.6. The system took photographs of the condition of the brake shoes, which were later compared with photographs of the brake shoes taken after the derailment (Figure 21).
![Photographs of the brake shoes on car CNPX 3373 taken by the train inspection portal system at Mile 85.6 of the Maple Creek Subdivision on 11 September 2020 (top row) and photographs of the same brake shoes taken after the derailment (bottom row) (Source: Canadian Pacific [top row] and TSB [bottom row])](/sites/default/files/eng/rapports-reports/rail/2020/r20v0185/images/r20v0185-figure-21.jpg)
* The brake shoe from the L3 position was not recovered.
As the figure shows, the brake shoes were significantly more worn when the derailment occurred, to an extent unusual for only 4 days of service. On average, brake shoes in potash service on this route last 8 to 10 months.
Although the brake shoe for the L3 wheel was not recovered by the TSB, post-occurrence on-site mechanical inspections (independently performed by CN and CP) determined that there was no friction material left on the L3 brake shoe (Figure 22) and these portions of the backing plate were in contact with the wheel tread surface. This wear condition would have developed at some point after the train departed Boston Bar.
The TSB laboratory examined the brake shoes recovered from car CNPX 3373 after the derailment. It found that the brake shoes in the R1 and L1 positions exhibited uneven wear from top to bottom. The top portions had been worn to the backing plate, while the bottom portions still had brake shoe material. The brake shoes in positions R2 and L2 had no brake shoe material left, and the metal backing plates had been blued. The brake shoe at position R3 had some remaining material but had a glazed appearance over the whole surface. The brake shoes from the R4 and L4 positions were the thickest and exhibited some glazing. The glazed appearance of the shoes indicates that the shoes experienced elevated temperatures due to prolonged contact with the wheel treads.
The maintenance records also indicate that 2 brake shoes were replaced on 13 January 2020; however, the wheel position of these shoes was not captured in the maintenance records as there was no requirement to do so. It is possible that the brake shoes on the L4 and R4 wheels were the ones that were replaced, which could explain the additional material observed on these shoes.
1.9 Conditions for railcar wheels to drop into gauge
A railcar wheel can drop into gauge on curved or tangent track under some circumstances such as if the track gauge has spread due to a loss of lateral restraint or when a wheel’s tread width is reduced from outboard rim failure.
Track gauge requirements are indicated in the TSR, which stipulate a width of 56.5 inches for standard gauge.Footnote 33 Track gauge must be within prescribed limits. On Class 4 track, as in this occurrence, a gauge that exceeds standard gauge by 1 inch is considered an urgent defect that requires immediate correction.
The AAR stipulates design requirements for freight cars in North America. According to AAR specifications, the standard width of a carbon steel wheel set (such as the wheel sets for car CNPX 3373 in this occurrence), when measured back to back between the wheels on the same axle, is 53 inches;Footnote 34 the standard width of the wheel, including a 1-inch flange, is 5.7 inches.Footnote 35 The total distance from inside of one wheel flange to the outer edge of the other wheel is 59.7 inches.
On tangent track, a wheel set in good condition would only drop into gauge if the gauge were 3.2 inches wider than standard gauge.
In the absence of a wide gauge defect, a wheel that dropped into gauge is an indication that the wheel set width was below the required tolerances due to a wheel rim failure.
1.10 Conditions for a railcar wheel set to stop rotating
A wheel set can stop rotating and skid when the adhesion force (vertical force multiplied by top-of-rail adhesion) is less than the brake retarding force (brake shoe force multiplied by the coefficient of friction of the brake shoes).
The adhesion force will drop if either the vertical force is low (for instance, on a lightly loaded or empty car, or in a situation of dynamic wheel unloading on a loaded car)Footnote 36 or if the rail adhesion is low (for instance, in the presence of excessive rail lubrication or moisture).
The brake retarding force is only present when brakes are applied (air brakes, hand brakes, or a combination of both), and therefore a railcar wheel set can only lock when brakes are applied.
1.10.1 Wheel locking on empty cars with hand brakes applied
The visual examination of the recovered wheel sets performed at the TSB laboratory found tread buildup on some of the wheels. Tread buildup is the result of a car’s brakes having been applied with a sufficiently high force to prevent the wheels from rotating freely for an extended period.
Wheel tread buildup is normally associated with empty cars. There is documented evidence that the application of hand brakes on an empty or lightly loaded railcar can cause the wheels to overheat and build up material on the tread due to the locked wheel sliding on the running surface of the rail head. The U.S. National Transportation Safety Board (NTSB) investigated the derailment of a CSX train in Hyndman, Pennsylvania, U.S., that occurred on 02 August 2017. In this accident, after the train had stopped on a 2% descending grade, the crew applied hand brakes on 33 cars, some of them empty. As the train was descending a 2% grade, the trailing truck on the 35th car (an empty car) derailed as it was negotiating a curve; an additional 32 cars derailed 1.7 miles later. In its investigation report, the NTSB concluded that the application of hand brakes on empty railcars toward the front of the train consist caused the wheels of those cars to lock up, slide, overheat, and build up tread. The NTSB further concluded that the tread buildup on the wheel of the 35th railcar compromised the ability of the wheel flange to keep the wheels on the track as the train negotiated the curve, causing the derailment.Footnote 37
1.10.2 Drag testing of loaded potash railcars with hand brakes applied
To determine if it is possible for a wheel set of a loaded car, such as car CNPX 3373 in this occurrence, to stop rotating freely when the brakes are applied, drag tests were conducted at the Canpotex facility in Guernsey, Saskatchewan, on 22 June 2021. For testing purposes, 3 fully loaded potash cars (car CNPX 3373 and 2 sister cars in the same railcar fleet)Footnote 38 were coupled together and pulled by a locomotive. The tests did not include theoretical scenarios involving cars with a reduced weight (i.e., reduced vertical load), for instance due to a dynamic change in weight distribution from a wheel suddenly dropping into gauge.
A total of 8 drag tests were performed on the 3 fully loaded cars, using different combinations of hand brake and/or air brake applications (Appendix D).
In each test, the wheel sets on all 3 cars rotated freely with the hand brake and the air brake applied and without any indication of locking up or of impending wheel lockup or sliding, whether momentarily or continuously. These results are consistent with industry common knowledge and experience.
1.11 Examination and testing of the brakes on car CNPX 3373
To help determine if an abnormal condition of the brakes on car CNPX 3373 may have contributed to the derailment, the air brake system and the hand brake on car CNPX 3373 underwent a series of tests and examinations, including a single car air brake test, a shoe force test, verification that the brake rigging and slack adjuster operated as intended, and an examination of the hand brake (Appendix E).
The following conclusions were drawn from the results:
- The air brake system on the car met the AAR Standard S-486.Footnote 39
- The brake forces were normally distributed on the car’s wheels, which indicates that there was no excessive brake application at any one of the wheel positions.
- The hand brake was functional.
- There were no structural, mechanical, or performance issues that would interfere with the proper and expected operation of the hand brake or air brake system on the car.
1.12 Fatigue conditions on railcar wheels
Railcar wheels in high mileage bulk service, such as potash service, undergo revolutions in the tens of millions and repeated cycles of braking, often under heavy axle load, while the car is in motion. These conditions place various stresses on the wheels, such as rolling contact stresses between the wheels and the rails and thermal stresses from the heat generated during braking. Over time, repeated exposure to these stresses reduces the yield strength of the steel and the wheels can develop various forms of fatigue.
1.12.1 Surface cracking
When the steel material reaches its ductility limit, hairline cracks, such as rolling contact fatigue cracks or thermal cracks, can form on the wheel tread surface.
These cracks take a long time to develop and typically only appear at the end of a wheel’s service life. Wheels are often replaced before surface cracks develop or become an issue. If such cracks do develop, however, further exposure to cyclic stresses under normal train operations will exacerbate the condition. If a wheel with surface cracking is exposed to excessive thermal stress from an abnormal situation, such as a stuck brake or a hand brake inadvertently left applied, the cracks could propagate at an accelerated rate.Footnote 40
Thermal cracks can also develop if the brake shoe friction material is completely worn away such that the steel backing plate comes in contact with, and abrades, the running surface of the wheel tread, a condition referred to as a burnt-in brake head. Rule 41 of the AAR Field Manual of Interchange Rules states, in part:
Thermal cracks are sometimes associated with overhanging brake shoes, tread bluing, or burnt-in brake heads but can be formed without any of these other conditions being present.Footnote 41
Although surface cracks may be triggered by different mechanisms, they propagate in a similar way, i.e., transverse to the wheel tread.
Wheel surfaces are visually inspected for cracks during safety maintenance inspections; although cracks of 0.10 to 0.25 inches might be observed, they could also quite easily be missed. For this reason, this type of damage can go unnoticed for an extended period.
1.12.2 Subsurface cracking
Class C wheels undergo heat treatment and rim quenching at manufacture, which gives the wheels a relatively small zone of beneficial axial residual compressive stresses at, and immediately below, the tread surface.
Over time, through repeated cyclic stresses during operation, the compressive stresses gradually increase, which causes a counter-balancing zone of axial residual tensile stresses to develop deeper below the tread surface. Subsurface cracks can develop in this zone, making the wheel prone to failure. The zone of maximum axial residual tensile stress typically forms 0.5 to 1.0 inches below the tread surface. Footnote 42 Research has demonstrated that repeated braking cycles appear to move the location of the axial residual tensile stress zone closer to the tread surface, to about 0.3 to 0.4 inches. Footnote 43
Cracks can also develop below the wheel tread surface due to manufacturing defects. For instance, very small internal inclusions or deformations in the steel at the time of manufacture can grow with extended service mileage and eventually crack.
1.12.3 Vertical split rim failures
Vertical split rim (VSR) failures are typically related to wheel fatigue conditions from service wear. One of 2 conditions are usually present in a wheel when a VSR failure occurs: cracks on the tread surface (such as rolling contact fatigue cracks, thermal cracks, shells, or spalls) or cracks below the surface (either due to pre-existing inclusions or deformations in the steel). VSR failure occurs when the cracks (surface or subsurface) propagate into the zone of axial residual tensile stresses, causing a section of the wheel outboard rim to break away from the wheel.
Figure 23 shows a cross-section view of a wheel with surface delamination; in this case, a horizontal subsurface crack that has propagated horizontally and, subsequently, also propagated vertically, which is typical of wheels that develop VSR failure.
A common service life for wheels that fail due to VSR is 10 years. Wheels that fail due to VSR have a residual stress pattern that is almost identical to a service-worn wheel (Figure 24).Footnote 44
![Residual stress pattern of service-worn wheels and wheels having failed from a VSR, compared to the residual stress pattern of a new wheel (Source: U.S. Department of Transportation, Federal Railroad Administration, Broken Rims in Railroad Wheels, report number DOT/FRA/ORD-14/41 [December 2014], modified by the TSB for clarity)](/sites/default/files/eng/rapports-reports/rail/2020/r20v0185/images/r20v0185-figure-24.jpg)
Researchers continue to study VSR wheel failures. A paper presented at the 2012 Joint Rail Conference indicated:
[…] Anecdotal evidence suggests that VSR wheel failures have been increasing in recent years as axle loads have increased. Much effort has been spent on the part of railroads, wheel manufacturers and other organizations to establish the root cause(s) of these failures. Based upon observations […] VSRs almost exclusively start at areas of tread damage, then propagate below the wheel tread for some period of time before a large circumferential section of the wheel fractures off. Both cast and forged wheels have suffered VSRs in service, and multiple wheel designs have experienced VSRs. Typically, the front rim face of the wheel breaks off, although a few failures have been noted with the back rim face and flange broken off the wheel. VSRs do not always end in derailment, but certainly can do so since the rim width has been narrowed by the failure.Footnote 45
VSR wheel fractures typically occur between 1 and 2.75 inches from the front rim face and can range in length from 6 inches to the entire wheel circumference.Footnote 46
Since 2002, 7 occurrences involving VSR wheel failures have been reported to the TSB, 5 of which have led to TSB investigation reports.Footnote 47
Many wheels that develop a VSR failure can also exhibit physical damage near the edge of the tread on the field side of the wheel. This area is not fully scanned by WILDs, which are traditionally installed on tangent track and record wheel impacts toward the middle of the wheel tread (tapeline). Consequently, emerging VSR conditions remain undetected.
Confirming that a broken wheel or a derailment is specifically due to a VSR is not always possible post-occurrence. Most of the time, the fractured rim or tread surface (or both) sustains significant damage as the failed wheel derails, therefore obliterating any evidence that subsurface voids, inclusions, or development of axial residual tensile stresses were present in the fracture area.
1.13 Fatigue conditions on the L3 wheel
Given that the L3 wheel failed in this occurrence (it had lost approximately 1.75 inches of rim width from the outboard rim face), the investigation delved deeper into its service history and whether it had shown signs of fatigue before the derailment.
1.13.1 Service history
Car CNPX 3373 had a design gross rail load capacity of 286 000 pounds and a lading capacity of 226 900 pounds. The car was used in potash service with the wheels regularly subjected to heavy axle loads.
During its entire service life, the L3 wheel on this car was operating in loaded train service every 7 to 10 days on CP’s Laggan and Mountain subdivisions, where it was subjected to extended braking cycles of about 60 minutes on steep downgrades at relatively low speeds (20 mph or below). At the time of the derailment, the L3 wheel had been in continuous service for 11 years, more than twice as long as the typical service life of wheels operating in potash service under these conditions.
1.13.2 Surface and subsurface cracking
Post-occurrence examination of the L3 wheel by the TSB laboratory did not indicate the presence of rolling contact fatigue cracks or thermal cracks. The wheel sustained extensive damage in the derailment; it also developed rusting surface conditions before it arrived at the TSB laboratory. It is possible that evidence of surface cracks, if such cracks were present, was obliterated.
The L3/R3 wheel set was sent to third-party facilities for further inspection, to determine if there were any inclusions or deformations in the steel that could have led to a VSR failure. TSB investigators were present to oversee the inspections.
1.13.2.1 Inspections performed by Progress Rail
The TSB retained the services of Progress Rail to perform ultrasonic inspections on the L3 and R3 wheels. The inspections, performed on 09 April 2021, did not identify any internal defects, inclusions, or cracks in the wheels that were above the condemnable limits for reprofiled wheels.
1.13.2.2 Inspections performed by the Quality Engineering Test Establishment
The TSB retained the services of the Quality Engineering Test Establishment to perform additional ultrasonic inspections, as well as magnetic particle inspection, on the L3 wheel. The inspections, conducted on 02 November 2021, did not identify any internal defects, inclusions, or cracks in the wheel.
1.13.2.3 Inspections performed by Team Industrial
The TSB retained the services of Team Industrial to perform X-ray inspections (computed/conventional radiography) of the L3 wheel. The inspections, performed on 15 and 16 December 2021, did not identify any internal defects, inclusions, or cracks in the wheel.
1.13.2.4 Measurement of axial residual stress
To determine axial residual stress in the L3 and R3 wheels, a radial sample from each wheel (Figure 25) was sectioned at the TSB laboratory (the rim sections were separated from the plate sections) and sent to McMaster Analytical X-Ray Diffraction Facility (MAX) for X-ray diffraction analysis.
It should be noted that the wheel tread surfaces on the R3 and L3 wheels had previously undergone some truingFootnote 48 to clean up any tread buildup and prepare the surfaces for ultrasonic inspections post-derailment. Compared to the R3 wheel, the L3 tread had required more truing due to the larger amount of scuffing damage and material buildup. To accommodate ultrasonic inspection, approximately 0.14 inches of the L3 tread surface had been removed.
The MAX laboratory conducted stress profiling examinations of the radial samples from the L3 and R3 wheels.
For stress profiling, several measurements are taken along a line of a cross-section. In this occurrence, the measurement line for L3 was marked at approximately 0.4 inches from the outboard edge; for R3, it was marked approximately 2 inches from the outboard rim face. The marked line location on the L3 section would be approximately equal to the marked line shown on R3, had the rim on the L3 wheel remained fully intact.
Seven measurement locations were marked along these lines (figures 26 and 27), equally spaced perpendicular to the remaining rolling surface of the tread. The distance between measurements was approximately 0.2 inches with the first measurement 0.2 inches below the worn and machined (trued) tread surface. Given that about 0.14 inches of the L3 tread surface had been removed, a measurement of 0.2 inches from the surface of the L3 section would correspond to a depth of 0.34 inches from what would otherwise have been the original tread surface.
Measured values of the axial residual stress are shown in tabular form in Table 3, as well as graphically in Figure 28.
| Measurement | Depth (inches) | L3 Stress (1000 psi) | R3 Stress (1000 psi) |
|---|---|---|---|
| 1 | 0.20 | -6.18 | -3.10 |
| 2 | 0.39 | -0.41 | -0.19 |
| 3 | 0.59 | 3.47 | 1.52 |
| 4 | 0.79 | 5.85 | 1.91 |
| 5 | 0.98 | 5.28 | 1.77 |
| 6 | 1.18 | 9.88 | 0.93 |
| 7 | 1.38 | 13.66 | -10.98 |
* Negative values indicate compressive stress and positive values indicate tensile stress.
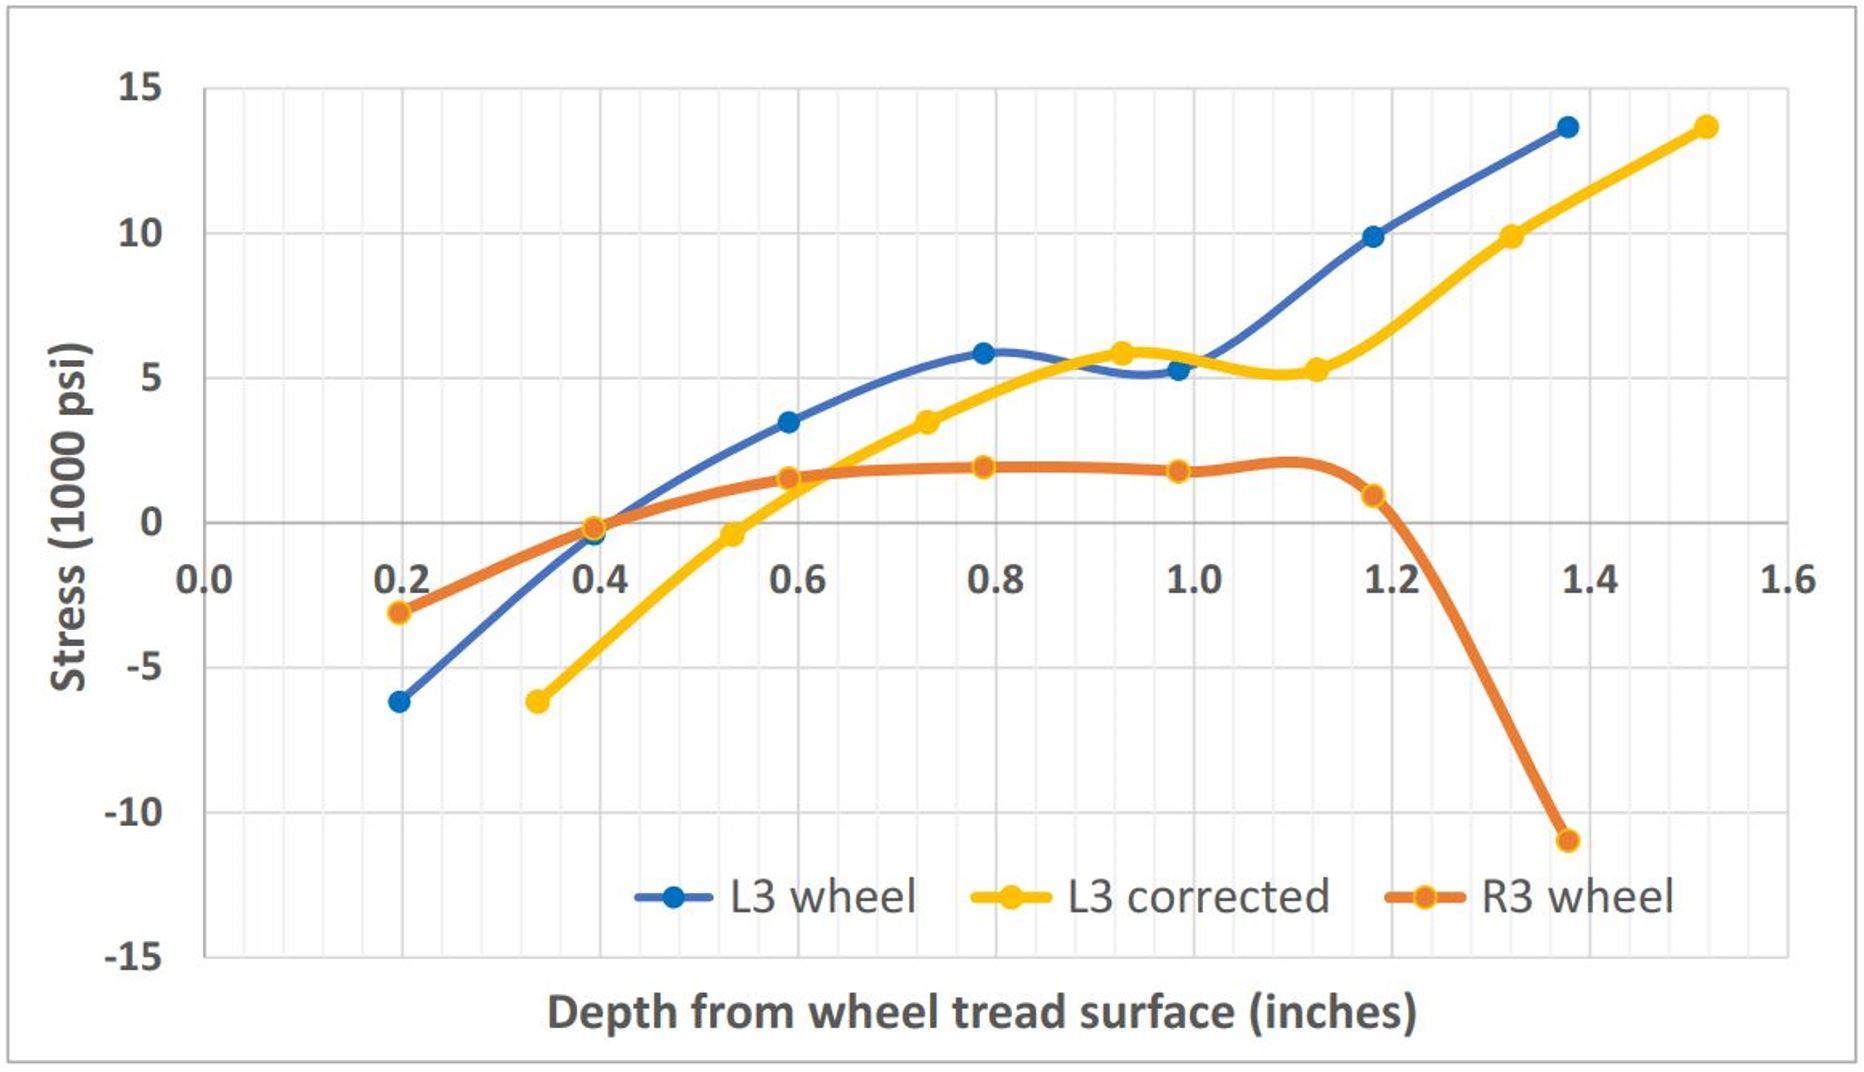
* The line labelled “L3 corrected” is the L3 values offset by 0.14 inches, to account for the previous wheel tread surface removal and correct the measurements to the virtual tread surface; it is thus more representative of the axial residual stress locations referenced to the original tread surface.
The data shows that the axial residual stresses were compressive in magnitude up to a depth of about 0.4 inches from the tread surface for R3 and about 0.53 inches for L3, before becoming tensile in magnitude below this depth. R3 returned to an axial residual compressive stress below about 1.2 inches. The maximum recorded axial residual tensile stress was approximately 13 500 psi for L3 and about 2000 psi for R3.
It is worth noting that other wheel loading conditions, such as bending and thermal effects, could reduce the axial residual compressive stresses in the region of the wheel tread. Axial residual stress values can also vary around the circumference of the wheel, and its magnitude could be different depending on where the wheel section is taken for X-ray diffraction testing.
1.14 Cleanup response and environmental remediation
After the derailment, 5 049 350 kg of released potash was sent to a landfill, 1 357 920 kg was recovered and repurposed or composted,Footnote 49 and approximately 275 000 kg was salvaged.
1.14.1 Site remediation
The following remediation actions were taken at the derailment and staging sites:
- The potash, derailed equipment, and track components were removed.
- The soil was regraded and scarified to mitigate the compaction of the soil.
- Riprap was installed upstream and downstream of the train bridge to reinstate bank protection.
- The areas were seeded and covered with biodegradable erosion control matting.
- Native woody plant species were planted.
- Sediment barriers were installed along the top of the stream bank.
In addition, the channel was realigned using a berm over a length of approximately 50 m to direct flows away from the spilled potash.
Restoration downstream of the creek consisted of removing any residual debris, which was minimal.
Finding: Other
The Ministry of Environment and Climate Change Strategy of British Columbia was satisfied with CN’s actions for emergency response cleanup.
The Environmental Emergency Program toxicologist for the Ministry indicated that the site environmental recovery process is still ongoing.
1.14.2 Impact on waterways
Fisheries and Oceans Canada reported that approximately 500 kg of potash spilled below the high-water mark of Hunter Creek. Footnote 50
Fisheries and Oceans Canada further reported the following:
- Repairs to the train bridge were expected to have minimal impact on the aquatic habitat, taking into account that the site had been isolated and a fish salvage haven had been set up before the repairs were undertaken.
- Functions of the riparian zone (bank stability, nutrient inputs, surface water filtration, shading) remained largely intact for both the Fraser River and Hunter Creek, with residual pressures not expected to persist beyond 1 year.
- There was disturbance to fish passage and water quality from the derailment.
- Ongoing environmental monitoring of the site found a return of fish to the watercourse.
- Surface water quality sampling and sediment sampling showed a return to baseline conditions upstream and downstream of the occurrence site.
- The repairs were unlikely to affect the species at risk given the small area concerned, the short duration of the repairs, and the fact that other suitable habitats for the species were nearby.
- There were no violations of the Canadian Fisheries Act or the Species at Risk Act.
Immediately following the derailment, CN began water testing. Test results showed that, 4 hours after the derailment, the water quality was unaffected. The testing continued until December 2020, and the results suggest that the derailment had no impact on the water quality of Hunter Creek or the Fraser River.
1.15 TSB laboratory reports
The TSB completed the following laboratory reports in support of this investigation:
- LP142/2020 – Wheelset and rail fracture examination
- LP041/2023 – Metallurgical examination of railway wheels
2.0 Analysis
There was no indication that train handling issues contributed to this occurrence.
Car CNPX 3373, the 65th car in the train consist, was the first to derail. The wheels on this car had high temperature readings throughout the trip. Post-occurrence inspection of this car focused on the 2 wheel sets that were found with significant damage to the wheels (L3/R3 and L4/R4). The L4/R4 wheel set was leading in the direction of travel and was immediately ahead of the L3/R3 wheel set. The inspection indicated that the L3 wheel dropped into gauge, and that the L4/R4 wheel set stopped freely rotating, skidded over a distance, then partially rotated twice. The L4 wheel also gradually dropped into gauge twice.
The analysis will therefore focus on the following regarding car CNPX 3373:
- possible causes for the elevated wheel temperature readings on this car
- the conditions that led the L4/R4 wheel set to stop rotating
- the conditions that led the L4 and L3 wheels to drop into gauge
From the available information, the most likely derailment sequence will be presented.
In addition, the following will be discussed:
- the procedure in effect at Canadian National Railway Company (CN) to address elevated wheel temperatures on railcars
- CN’s requirements for train inspections for non-key trains
2.1 The occurrence
On 14 September 2020 at about 0433, CN freight train J60352-12 was travelling westward at about 50 mph on the Yale Subdivision when 61 cars loaded with potash derailed, resulting in a pile-up between Mile 46.9 and Mile 47.7 in an area near Floods. Fifty-eight of the derailed cars breached, releasing approximately 6 000 000 kg of product.
Post-occurrence site examination found 4 distinct breaks in the south rail (miles 45.24, 46.14, 46.5, and 46.7 of the Yale Subdivision). Laboratory examination of pieces of the broken rail determined that the fractures were located at thermite welds and were brittle in nature, which indicates that the rails did not have pre-existing defects. Thermite welds can act as stress risers, making the rail more susceptible to overstress failures under high lateral forces.
Finding as to causes and contributing factors
A sudden break of the south rail at multiple thermite weld locations occurred under CN freight train J60352-12, leading to the derailment of 61 cars in a pile-up starting at Mile 46.9 (Hunter Creek Bridge) and extending westward to Mile 47.7 (St. Elmo Road crossing) on the Yale Subdivision.
The initial point of derailment involving car CNPX 3373 was determined to be at about Mile 44.4. At this location, there was evidence of lateral movement of the south rail, and the gauge face of this rail had the appearance of a machined surface; in addition, there were sheared-off bolts and a damaged insulated joint bar. This damage is consistent with a railcar wheel dropping into gauge at this location.
Car CNPX 3373 was found with the 2 wheels on the left-hand side of the leading truck (L4 and L3 in the direction of travel) dropped inside the track gauge. When a railcar wheel drops into gauge, its outer rim comes in contact with the gauge side of the rail, exerting a lateral force that can cause extensive damage to both the wheel and the track structure.
Finding as to causes and contributing factors
Car CNPX 3373, the 65th car in the train consist, was the first car to derail; the L4 and the L3 wheels on this car were found dropped inside the track gauge. The derailed wheels exerted lateral pressure against the gauge side of the south rail, causing it to break at 4 thermite weld locations, leading to the derailment of subsequent cars.
2.2 Elevated wheel temperatures on car CNPX 3373
A review of the data from 3 wayside wheel temperature detectors (WTDs) between Boston Bar and the occurrence location revealed that the wheels on car CNPX 3373 had elevated temperatures (300 °F or higher) on at least 2 wheels at every detector location. In comparison, the rest of the wheels on the train averaged about 17.5 °F over the same detectors.
Elevated wheel temperatures indicate that the brake shoes on a railcar are in contact with the wheel tread, suggesting that there could be an issue with either the air brake, the hand brake, or both.
Finding as to causes and contributing factors
High wheel temperature readings for car CNPX 3373 from 3 WTDs indicate that the brake shoes on this car were in contact with the wheel treads between Boston Bar and the derailment location.
2.2.1 Examination and testing of the brakes on car CNPX 3373
To determine whether there was a stuck brake condition on car CNPX 3373 that may have contributed to the elevated wheel temperatures, the air brake system on car CNPX 3373 underwent examination and testing, including a single car air brake test, a shoe force test, and verification that the brake rigging and slack adjuster operated as intended. The hand brake was also examined. The results indicated that the brakes on car CNPX 3373 met the requirements established by the Association of American Railroads and by Transport Canada. There were no indications of any structural, mechanical, or equipment performance issues that would have interfered with the proper and expected operation of the air brake system, the hand brake, or a combination of both.
Finding: Other
Post-derailment examination and testing of the air brake and hand brake components on car CNPX 3373 determined that the brake systems on this car were performing as expected.
2.2.2 Possible source for a brake retarding force on car CNPX 3373
The elevated wheel temperatures on car CNPX 3373 indicate that there was a brake retarding force on this car.
Given that there was no evidence of a pre-existing mechanical condition with the brake systems on car CNPX 3373, and given that the positive reduction made after Komo did not eliminate the elevated wheel temperature condition, the investigation looked into the possibility that the hand brake may have inadvertently been left fully or partially applied.
Car CNPX 3373 was first in a series of 5 cars at the west end of the tail-end cut of cars on track 2 in the yard at Boston Bar that had been secured with hand brakes; this cut of cars was reported to have had hand brakes released after the cars were coupled together during the double-over operation before departure.
The hand brake was found in the released position when TSB investigators examined the car. The hand brake had been inspected by the conductor immediately after the derailment, and subsequently by other railway personnel who later responded to the derailment before the TSB arrived on site. In this occurrence, there was no scientific method to validate when the hand brake was released.
2.2.3 Wheel damage from sustained elevated wheel temperatures
Based on brake horsepower (BHP) calculations conducted by the TSB for car CNPX 3373 in this occurrence, the L3 wheel was exposed to BHP values more than twice as high as those that the wheel was designed to withstand, and for almost double the amount of time that braking would be applied on a wheel while descending the longest grades in Canadian potash service.
The excessive thermal stress, in combination with the following factors, created favourable conditions for wheel thermal damage:
- The wheels on car CNPX 3373 had been in service for a considerable number of years. The L3 wheel, in particular, had been in continuous potash service on CP’s Laggan and Mountain subdivisions for 11 years, more than twice as long as the typical service life of wheels operating on this territory. It is therefore most probable that some wheels, especially the L3 wheel, had developed fatigue conditions, such as surface cracking, that went undetected.
- Although the highest WTD reading for the L3 wheel was 544 °F at Komo, the temperature at the tread would have been about 150 °F hotter. WTDs report an average value of multiple readings taken at various locations on the wheel, including the flange, rim, and plate, but not the tread. However, the highest temperature is typically produced on the tread surface when the brake shoe friction material is in contact with the tread. Hence the tread temperature of the L3 wheel at Komo could have been near 700 °F, well above a temperature which would have significantly reduced the yield strength of the steel.
- The prolonged contact between the brake shoe and the wheel tread on the L3 wheel led to a burnt-in brake head, where there was no friction material left on the brake shoe (Figure 22). This resulted in portions of the steel backing plate coming in direct contact with, and abrading, the running surface of the wheel tread, which was already under excessive thermal stress.
These conditions could have accelerated the propagation of pre-existing surface or subsurface cracks.
Finding as to causes and contributing factors
Sustained, excessive thermal stress beyond the thermal capacity of a 36-inch diameter Class C wheel, in combination with the abrading effect of a burnt-in brake head, may have accelerated the propagation of pre-existing surface or subsurface cracks on the L3 wheel, which already had reduced yield strength from long service wear.
The brake retarding force calculations can also be used to substantiate whether the elevated wheel temperatures could have been caused by an applied hand brake. In this context, the net hand braking ratio Footnote 51 for car CNPX 3373 was calculated.
Based on the calculated brake retarding force of 1017 pounds at Komo, the net braking ratio at that location would have been about 8.9%, Footnote 52 which is equivalent to a tightly applied hand brake and represents a typical value expected for the securement of rolling stock. A net braking ratio of 8.9% is also within the upper range of the shoe force data obtained during 4 instrumented brake shoe tests conducted on car CNPX 3373 at Thornton Yard on 18 September 2020 (Appendix E), and this reinforces that the hand brake on this car may inadvertently have been left fully applied.
The calculated average wheel temperature on car CNPX 3373 at Komo, Yale, and Hope (381 °F, 310 °F and 275 °F respectively) also supports the conclusion that a hand brake was applied on this car: these temperatures were in a similar range to WTD temperature readings for 3 exemplar trains that had been stopped for warm wheels and were found, upon inspection, to have had a hand brake applied on a railcar (200 °F and 400 °F).
Brake retarding force calculations, and wheel temperature data from 3 different trains where a car was found to have a hand brake applied, further support the assertion that there was a hand brake fully applied on car CNPX 3373 between Boston Bar and the derailment location.
Finding as to causes and contributing factors
The investigation determined that the likely cause of the elevated wheel temperatures on CNPX 3373 as the train passed the 3 WTDs between Boston Bar and Floods was a hand brake that inadvertently had been left fully applied at Boston Bar.
2.3 Condition of the wheels on car CNPX 3373
After the occurrence, the TSB laboratory examined the recovered wheel sets from car CNPX 3373 (L4/R4 and L3/R3) to help determine the wheels’ modes of failure and the factors that may have played a role in the derailment.
The L4 wheel had 3 significant slid flat spots, 2 sets of rail marks that bisected its rim, and tread buildup; this damage indicates that the wheel stopped rotating and skidded over a distance, partially rotated twice, and gradually dropped into gauge twice.
The face of the L3 wheel outboard rim was worn down by approximately 1.75 inches; the pattern on the outer rim was consistent with continuous contact with, and rotation against, the gauge side of the rail head.
The investigation looked into possible causes for the damage observed to these wheels.
2.3.1 Locking of the L4/R4 wheel set
A wheel can stop rotating and skid when the adhesion force between the wheel and the rail is less than the brake retarding force.
The adhesion force will drop if either the vertical force is low (for instance, on a lightly loaded or empty car, or in a situation of dynamic wheel unloading on a loaded car) or if the rail adhesion is low (for instance, in the presence of excessive rail lubrication or moisture).
2.3.1.1 Rail lubrication
Excessive amounts of lubrication will lower the adhesion between the wheel and the rail; in such situations, the brake force on loaded cars can prevent a wheel set from rotating freely and cause it to slide. However, in this occurrence, there was no evidence of excessive rail lubrication or rail surface contamination in the vicinity of the derailment; consequently, it is unlikely that excessive rail lubrication caused the L4/R4 wheel set to stop rotating.
2.3.1.2 Effects of applied brakes on fully loaded railcars
There is documented evidence that the application of hand brakes on empty railcars can cause the wheels of those cars to lock up, slide, and overheat, resulting in the tread building up.
The United States National Transportation Safety Board (NTSB) investigated the derailment of a CSX train in Hyndman, Pennsylvania, United States, that occurred on 02 August 2017. In its report of this occurrence, NTSB/RAR-2004, the NTSB concluded that the application of hand brakes on empty railcars toward the front of the train consist caused the wheels of those cars to overheat and build up tread. The NTSB further concluded that the tread buildup on the wheel of the 35th railcar compromised the ability of the wheel flange to keep the wheels on the track as the train negotiated the curve, causing the derailment.
However, the circumstances of the CSX derailment were very different from the derailment in this occurrence in which the cars were loaded and the track was nearly tangent.
To determine whether an applied brake could have locked the L4/R4 wheel set on car CNPX 3373, which was loaded with potash at the time of the occurrence, the TSB performed a number of drag tests on this car and 2 similar cars that were fully loaded.
In all the tests conducted, the wheel sets on all 3 cars rotated freely, without any indication of locking up, impending wheel lockup, or sliding, even with the application of hand brakes supplemented with an emergency brake.
The tests did not include scenarios involving cars with a reduced weight (i.e., reduced vertical load).
Finding: Other
Post-derailment testing revealed that, in the absence of a reduced vertical load, a hand brake left fully applied on a loaded car does not prevent the wheels from rotating during the motion of the car, even if the air brake is also applied in emergency.
2.3.1.3 Reduced vertical load
A wheel set on a railcar cannot stop rotating unless there is a brake retarding force present. However, even with brakes applied, the L4/R4 wheel set on fully loaded car CNPX 3373 would not have stopped rotating unless the adhesion force was low; since excessive rail lubrication and rail surface contamination were discounted in this occurrence, the adhesion force must have been lowered due to a reduced vertical load.
The investigation could not determine what, other than a wheel dropping into gauge, could have dynamically reduced the vertical load on the L4/R4 wheel set. The only wheel, other than L4, which is known to have dropped into gauge is L3.
The investigation theorized that, a few miles before the L3 wheel fully dropped into gauge, it began to run slightly on the gauge side of the south rail, just enough to begin wearing the rim. This would have caused an uneven distribution of vertical forces on the A-end truck, reducing the vertical load on the L4/R4 wheel set. The reduced vertical load, in combination with a brake retarding force, caused the wheel set to stop rotating.
Blueing on the rail surface can help determine where the wheel set skidded. In this occurrence, although intermittent blueing was observed post-derailment on the south rail as far back as Mile 39.0, it is unlikely that the wheel set stopped rotating much before Mile 42.9. If it had, similar blueing would have been observed on both rails (the wheels on a wheel set do not rotate independently), and the temperature readings for this wheel set would have been much higher at the wheel temperature detector at Hope (Mile 42.8).
Finding as to causes and contributing factors
It is likely that the L3 wheel dropped slightly into gauge around Mile 42.9, reducing the vertical force on the L4 wheel; consequently, the adhesion force on the L4 wheel became less than the brake retarding force, causing the L4/R4 wheel set to stop rotating and slide.
2.3.2 Dropping into gauge of the L4 and L3 wheels
Post-derailment, both the L4 and L3 wheels on car CNPX 3373 were found dropped inside the track gauge.
A railcar wheel can drop into gauge if its tread width is reduced from outboard rim failure. A wheel in good condition can only drop into gauge if the track gauge has spread. On curved or tangent track, such as the track in this occurrence, the gauge would have needed to be spread by more than 3 inches for a wheel with an intact tread width to drop into gauge.
In this occurrence, there was no indication of a pre-existing wide gauge defect, and the L4 wheel’s tread width was not reduced.
If the L4 wheel had dropped into gauge first, it would have widened the gauge such that the L3 wheel may not have ground against the gauge side of the south rail with sufficient force to remove 1.75 inches of wheel rim material and create the machined outer rim surface observed post-derailment.
Consequently, the most probable scenario is that the L3 wheel dropped into gauge first.
2.3.2.1 Vertical split rim failure on the L3 wheel
Given that the L3 wheel dropped fully into gauge at Mile 44.4, and given the likelihood that it began to fall slightly into gauge closer to Mile 42.9, reducing the vertical load on the L4/R4 wheel set and causing it to stop rotating, the investigation looked into whether a vertical split rim (VSR) failure had occurred on the L3 wheel.
VSR failures are typically related to wheel fatigue conditions from service wear. Over time, repeated exposure to cyclic loading (contact stresses at the wheel tread surface), and thermal stresses reduces the yield strength of the steel and the wheels can develop various forms of fatigue, such as hairline cracks on the tread surface. Since fatigue conditions develop slowly, VSR failures are usually associated with older, service-worn wheels or wheels in heavy service.
In this occurrence, the service history of the L3 wheel made it more vulnerable to a VSR failure. Since 2011, the wheel was used in continuous potash service on CP’s Laggan and Mountain subdivisions, which are characterized by long, steep descending grades. The wheel was therefore repeatedly subjected to extended braking cycles of about 60 minutes, in heavy axle load conditions.
One of 2 conditions are usually present in a wheel for a VSR failure to occur: cracks on the tread surface (such as rolling contact fatigue cracks, thermal cracks, shells, or spalls) or cracks below the surface (from pre-existing inclusions or deformations in the steel). VSR failure occurs when the surface or subsurface cracks propagate and connect with the zone of axial residual tensile stress, causing a section of the wheel outboard rim to break away from the wheel.
With respect to surface cracks, a review of data from wheel impact load detectors (WILDs) confirmed that the L3 wheel did not have shells or spalls. Previous field inspections of the wheel did not indicate the presence of rolling contact fatigue cracks or thermal cracks; however, these cracks are difficult to see and often go unnoticed during inspections. The presence of such cracks could also not be confirmed post-occurrence. The wheel sustained extensive damage in the derailment; it also developed rusting surface conditions before it arrived at the TSB laboratory; hence, it is likely that the evidence of surface cracks, if these cracks were present, was obliterated. Given the wheel’s service history, it is highly likely that it had developed surface cracks over time.
With respect to subsurface cracking, the wheel set was subjected to ultrasonic and X-ray inspections to determine if it had pre-existing inclusions or cracks. Inspections were conducted at 3 independent third-party facilities, with TSB investigators present to oversee. The inspections did not identify internal defects. However, it is possible that, after the wheel dropped into gauge, all subsurface witness marks of possible inclusions were destroyed, ground away by contact between the rim of the wheel and the gauge face of the rail.
With respect to axial residual stress, an X-ray diffraction test was conducted to determine if tensile stress was present in the L3 wheel. The results indicated the presence of residual stress; the axial residual stresses were compressive in magnitude up to a depth of about 0.4 inches from the tread surface for R3 and about 0.53 inches for L3, before becoming tensile in magnitude below this depth. The residual stress on the R3 wheel returned to an axial residual compressive stress below about 1.2 inches. The maximum recorded axial residual tensile stress was approximately 13 500 psi for L3 and about 2000 psi for R3.
Several factors and elements of the L3 wheel’s loss of rim width from its outboard rim face were similar to those of a VSR failure:
- It was broken in an area between 1 and 2.75 inches of the front rim face.
- The broken rim portion was in the entire circumference.
- The wheel was over 11 years old. There was a zone of axial residual tensile stress.
For these reasons, the investigation theorized that the L3 wheel had a VSR failure where the failure origins of surface and subsurface defects were not identified through inspection.
Additionally, with respect to geometry, there was no pre-existing wide gauge defect to allow a wheel with its rim intact to drop into gauge.
Finding as to causes and contributing factors
It is most probable that, despite no indication of pre-existing surface or subsurface cracks, a VSR failure occurred, allowing the L3 wheel to progressively drop into gauge. The resultant contact between the wheel rim face and the gauge face of the south rail then destroyed any indication of the VSR failure.
2.3.2.1.1 Role of elevated wheel temperature in the vertical split rim failure on CNPX 3373
Wheel fatigue conditions such as surface or subsurface cracks that initiate VSR failure develop gradually with wheel age and repeated cyclic stresses. These cracks then propagate below the wheel tread surface over time and from additional mileage, connecting with an existing zone of axial residual tensile stress before a circumferential section of the wheel fractures off.
Given expected timeframes involved in VSR failures, the L3 wheel on car CNPX 3373 had an emergent condition that was trending toward a VSR failure. However, there was no indication that the wheel was damaged when the car last underwent a certified car inspection, nor was an alarm condition triggered by a wayside detector when the car travelled from Kamloops to Boston Bar on the day before the occurrence.
Car CNPX 3373 departed Boston Bar on 13 September 2020 and the L3 wheel was exposed to elevated temperatures and excessive BHP levels for an extended duration. This thermal stress would have increased the rate of propagation of any pre-existing surface or subsurface crack. Exposure to excessive heat, therefore, did not directly cause the VSR, but accelerated its progress to failure.
The VSR failure mechanism is independent of thermal stress. Thus, even in the absence of elevated temperatures and BHP, the VSR condition on the L3 wheel would have eventually resulted in a wheel failure from the propagation of surface or subsurface cracks into the zone of axial residual tensile stress.
2.4 Derailment sequence
From the condition of the track and the wheels on car CNPX 3373 post-occurrence, and based on an analysis of the conditions that caused the L4/R4 wheel set to stop rotating and the L3 wheel to drop into gauge, the investigation has determined that the most probable derailment sequence was as follows.
The train left Boston Bar with the brake shoes on car CNPX 3373 in contact with the wheel treads, which led to the wheels having elevated wheel temperatures throughout the trip. The sustained elevated temperatures accelerated the growth of cracks on the L3 wheel, leading to the development of a VSR failure.
At some point before Mile 44.4, the L3 wheel began to fail. Part of the exterior of the rim came off and the wheel began to partially and progressively drop into gauge with each rotation, grinding material off the rim. As the failure progressed, more of the outer portion of the rim wore off, and there was an uneven distribution of the vertical forces on the leading A-end truck. Due to the reduced vertical load on the L4/R4 wheel set and the presence of a mechanical brake retarding force, the L4/R4 wheel set stopped rotating, explaining the first slid flat on the wheels. The vertical load on the L4/R4 wheel set fluctuated in accordance with the movements of the L3/R3 wheel set, causing the L4/R4 wheel set to resume turning, at least partially, then stop rotating, creating the second slid flat on both wheels of the wheel set. The L4 wheel dropped into gauge, made contact with track components and subsequently climbed out, skidded at a new wheel position, and then dropped back in. These events are supported by the 3 slid flats on the treads of both the L4 and R4 wheels and the 2 sets of grooves observed in the rim of the L4 wheel.
At Mile 44.4, the outer portion of the rim on the L3 wheel failed around its entire circumference, and the wheel fully dropped inside the gauge but continued rotating. The dropped wheel ground against the gauge side of the rail head until the train came to a stop.
Based on the extensive gouging of the L4 wheel rim, which was made by contact with the gauge face of the head of the south rail, it is likely that the L4 wheel was also derailed by Mile 44.4.
With both the L4 and the L3 wheels on car CNPX 3373 having dropped into gauge, the lateral pressure against the gauge side of the south rail caused the rail to break at 4 thermite weld locations (miles 45.24, 46.14, 46.5, and 46.7), leading to the catastrophic rail failure under the train.
2.5 Canadian National Railway Company’s procedure for warm wheels
CN’s Warm Wheel Procedure indicates what steps must be taken when a railcar has “warm wheels” (temperature readings of 300 °F or higher); according to CN’s procedure, action must be taken under the following circumstances:
- the majority of the detectors over which the train passes on a subdivision show high wheel temperature readings (300 °F or higher);
- there are 2 consecutive detector readings of 350 °F or more; or
- there is a single reading of 400 °F or higher.Footnote 53
In these circumstances, as a first action, the crew must perform a positive reduction (an application of the train brakes to create a brake pipe pressure reduction of at least 6 psi at the rear of the train). If the wheel temperature does not reduce and return to normal range (i.e., 2 consecutive detector readings of 150 °F or lower), the cars with warm wheels must be inspected at the next crew change or repair terminal, whichever is closer.
Car CNPX 3373 was the only car to have elevated wheel temperatures after leaving Boston Bar. At the second wayside detector location (Komo, Mile 13.8), 3 of the car’s wheels had readings above 400 °F. The locomotive engineer applied a 10 psi brake reduction as instructed and, after releasing the air brake application, the temperatures for the wheels were lower at the next 2 detector locations. However, the temperatures did not reduce to the normal range as all the readings were still above 150 °F. The temperature reduction is attributed to the quick wear of the brake shoes, which would have reduced the brake force on the tread of the wheels.
As the train was operating on CN’s track, and because the wheel temperature for car CNPX 3373 remained above CN’s specified warm wheel thresholds, the procedure required that the car be inspected at the next crew change or repair terminal, whichever was closer. The closest was the next repair terminal, at Chilliwack (Mile 71.8), approximately 29 miles past CN’s wayside detector at Hope. However, the train derailed before reaching the terminal.
Finding as to causes and contributing factors
The temperature thresholds in CN’s procedure for warm wheels allowed the train to continue in service, without timely inspection, after 3 consecutive alerts from wayside detectors.
In comparison, Canadian Pacific Railway Company’s procedure is more restrictive, as it requires a train be stopped and inspected after a second alert.
2.6 Canadian National Railway Company’s requirements for non-key train inspections at crew change locations
A pull-by inspection may identify safety issues on a train. According to CN’s General Operating Instructions, the requirements for trains to undergo pull-by inspections at a scheduled crew change location apply to trains that meet the following criteria: trains with cars that contain dangerous goods for which an emergency response assistance plan is required, and trains with cars that contain loads identified as “prone to shift.”
The occurrence train was carrying potash in covered hopper cars. Potash is not classified as a dangerous good under the Transportation of Dangerous Goods Regulations, and loaded covered hopper cars are not typically identified as “prone to shift.” The train was therefore exempt from a pull-by inspection at Boston Bar after the crew change.
In addition, because the train operated westward on a directional running zone and left at night at about 0218, there were no opposing eastbound train crews, or maintenance personnel at track side, who could have identified any anomalies on the passing train.
Finding as to risk
If pull-by train inspections are not performed after a train has been reassembled, there is a risk that a brake or wheel anomaly will go unnoticed.
3.0 Findings
3.1 Findings as to causes and contributing factors
These are conditions, acts or safety deficiencies that were found to have caused or contributed to this occurrence.
- A sudden break of the south rail at multiple thermite weld locations occurred under Canadian National Railway Company freight train J60352-12, leading to the derailment of 61 cars in a pile-up starting at Mile 46.9 (Hunter Creek Bridge) and extending westward to Mile 47.7 (St. Elmo Road crossing) on the Yale Subdivision.
- Car CNPX 3373, the 65th car in the train consist, was the first car to derail; the L4 and the L3 wheels on this car were found dropped inside the track gauge. The derailed wheels exerted lateral pressure against the gauge side of the south rail, causing it to break at 4 thermite weld locations, leading to the derailment of subsequent cars.
- It is likely that the L3 wheel dropped slightly into gauge around Mile 42.9, reducing the vertical force on the L4 wheel; consequently, the adhesion force on the L4 wheel became less than the brake retarding force, causing the L4/R4 wheel set to stop rotating and slide.
- It is most probable that, despite no indication of pre-existing surface or subsurface cracks, a vertical split rim (VSR) failure occurred, allowing the L3 wheel to progressively drop into gauge. The resultant contact between the wheel rim face and the gauge face of the south rail then destroyed any indication of the VSR failure.
- High wheel temperature readings for car CNPX 3373 from 3 wheel temperature detectors indicate that the brake shoes on this car were in contact with the wheel treads between Boston Bar and the derailment location.
- Sustained, excessive thermal stress beyond the thermal capacity of a 36-inch diameter Class C wheel, in combination with the abrading effect of a burnt-in brake head, may have accelerated the propagation of pre-existing surface or subsurface cracks on the L3 wheel, which already had reduced yield strength from long service wear.
- The investigation determined that the likely cause of the elevated wheel temperatures on CNPX 3373 as the train passed the 3 wheel temperature detectors between Boston Bar and Floods was a hand brake that inadvertently had been left fully applied at Boston Bar.
- The temperature thresholds in Canadian National Railway Company’s procedure for warm wheels allowed the train to continue in service, without timely inspection, after 3 consecutive alerts from wayside detectors.
3.2 Findings as to risk
These are conditions, unsafe acts or safety deficiencies that were found not to be a factor in this occurrence but could have adverse consequences in future occurrences.
- If pull-by train inspections are not performed after a train has been reassembled, there is a risk that a brake or wheel anomaly will go unnoticed.
3.3 Other findings
These items could enhance safety, resolve an issue of controversy, or provide a data point for future safety studies.
- The Ministry of Environment and Climate Change Strategy of British Columbia was satisfied with Canadian National Railway Company’s actions for emergency response cleanup.
- Post-derailment examination and testing of the air brake and hand brake components on car CNPX 3373 determined that the brake systems on this car were performing as expected.
- Post-derailment testing revealed that, in the absence of a reduced vertical load, a hand brake left fully applied on a loaded car does not prevent the wheels from rotating during the motion of the car, even if the air brakes are also applied in emergency.
4.0 Safety action
Safety action taken
The Board is not aware of any safety action taken following this occurrence.
This report concludes the Transportation Safety Board of Canada’s investigation into this occurrence. The Board authorized the release of this report on . It was officially released on .
Appendices
Appendix A – Glossary of terms related to wheel metallurgy
Ductility limit: A point beyond which the ability of a material to resist physical plastic deformation is exceeded.
Metal fatigue: Metal fatigue is the weakening of a metal’s mechanical properties, or an altering of its metallurgical properties (such as yield strength and ductility) from repeated stresses, ultimately resulting in fracture.
Plastic deformation: A permanent change in the dimensions of a material when it is subjected to a load beyond its elastic limit (the load beyond which the material is no longer able to recover its original shape when the load is removed).
Thermal cracking: Thermal cracking is a type of thermal damage that manifests itself by the appearance of cracks on a metal’s surface. In the context of railcar wheels, thermal cracks are caused by intense brake heating or the sliding of a wheel. The cracks occur crosswise on the wheel tread and are oriented parallel to the axle. Thermal cracking is a condemnable defect requiring immediate removal of the wheel from service.
Thermal damage: Thermal damage is a thermally induced deterioration of, or permanent change in, a metal’s mechanical or metallurgical properties (such as yield strength and ductility).
Thermal stress: Thermal stress is a thermally induced force exerted on a metal that typically causes expansion or contraction. This force can result from exposure to temperatures that exceed the design characteristics of the metal or from repeated cyclic loading. Thermal stress may lead to a permanent change in the material properties of the metal (thermal damage).
Yield strength: Yield strength refers to the ability of a material to resist permanent deformation. It is the amount of stress below which permanent plastic deformation will not occur.Footnote 54 Or, conversely, the amount of stress which will produce the onset of permanent deformation.
Appendix B – How wheel temperature detectors take measurements
Wheel temperature detectors (WTDs) are installed next to the track and usually aimed perpendicular to the rails, generally scanning passing wheels a few inches above the top of the rail.
WTDs use infrared sensor technology to thermally scan each wheel as it travels past the detector. The scan starts at the leading edge of the wheel in the direction of travel and ends when the trailing edge moves past the infrared beam. During the scan, the WTD takes multiple measurements across the lower portion of the wheel, along a horizontal path that includes the wheel flange, rim, and plate (Figure B1).
Heat generated by the wheel bearing is not detected by the WTD. For this reason, wayside inspection systems invariably include a hot box detector (HBD) as shown in Figure B1. The HBD houses an infrared sensor that measures the bearing temperature on the in-motion railcars as they travel past the detector.
![Wheel temperature detector multi-point scan (Source: T. Kerr, A. Aronian, A. Woelfle, K. Kiriyama, and T. Kato, Challenging the BC Coal Loop with High Hardness Alloy Wheels, 17th International Wheelset Congress [Kiev, Ukraine, 22-27 September 2013]](/sites/default/files/eng/rapports-reports/rail/2020/r20v0185/images/r20v0185-figure-29.jpg)
Figure B2 shows a representative temperature profile for a wheel scanned by a WTD. In this example, the reading is taken while a heavy brake is applied. For illustrative purposes, an abnormally high wheel temperature was used. The sequence of temperature measurement progresses from point 1 through to point 7.

The highest temperature will typically be produced on the tread surface when the brake shoe friction material is in contact with the tread; however, WTDs cannot obtain this temperature measurement due to the relative orientations of the tread surface and the infrared beam pattern.
Conversely, the coolest temperature will typically be produced on the plate, as it is the furthest away from the brake shoe contact point.
WTDs compute an average value from all the readings, using the manufacturer’s temperature averaging algorithm. These algorithms typically disregard the extreme highest and lowest values. The recorded temperature is therefore an average value and is typically 150 °F less than the surface of the wheel tread.Footnote 55
Appendix C – Brake retarding force calculations for car CNPX 3373
Brake horsepower (BHP) is a metric used to quantify the braking energy and induced thermal stress on a wheel. BHP equals the brake retarding force (BRF) times the speed (V), divided by 375, i.e., BHP = BRF x V / 375;Footnote 56 the brake retarding force is expressed in pounds and the speed in mph. Specific combinations of brake retarding force and speed are therefore required to produce thermal stress on railcar wheels. The duration of a brake application is also an important factor, as the longer a wheel is exposed to temperatures beyond its thermal capacity, the greater the risk of thermal damage.
To gain insight into the thermal stress on the wheels of car CNPX 3373 in this occurrence, the investigation calculated the BHP throughout the trip based on speed and brake retarding force inputs from Boston Bar to the location where the major derailment occurred. This BHP assessment is a theoretical analysis, intended to provide order-of-magnitude results and key insights into the thermal stress exerted on the L3 wheel on car CNPX 3373. Although the variations for some of the parameters (brake retarding force and coefficient of brake shoe friction) were not precisely known, the assumed or estimated values used in the calculations are within a representative range.
Because the actual brake retarding forces on car CNPX 3373 are not directly known at any point throughout the trip, they must be derived. In this investigation, the TSB chose to analytically derive the brake retarding forces to provide key insight into the thermal stress on the L3 wheel and quantify order-of-magnitude BHPs for the wheel throughout its trip.
As a starting point, an initial brake retarding force was estimated based on data from a representative train with known wheel temperature, brake application, and speed. Westbound loaded potash freight train CP 603-054 passed by a wheel temperature detector (WTD) at Mile 111.7 of the CP Mountain Subdivision on 30 March 2016; the average wheel temperature on the train, which was travelling at 20 mph with a 10 psi brake pipe pressure reduction, was 210 °F.
The calculations were made using the values for the L3 wheel on car CNPX 3373, as this is the wheel that eventually failed in this occurrence (its outboard rim face had been worn down by approximately 1.75 inches due to the wheel derailing inside the track gauge). The WTD at Komo recorded a temperature of 544 °F for this wheel; at the time, the train was travelling at 30 mph.
When the brakes are applied on a car, the brake shoe force and net brake retarding forceFootnote 57 are directly related to the strength of the brake application. The BSF = P L A N EFootnote 58 formula was used to determine that a brake retarding force of approximately 589 pounds will result from a 10 psi brake pipe pressure reduction on a potash car. By extension, a brake retarding force of 589 pounds due to a 10 psi brake pipe pressure reduction will result in an average wheel temperature reading of 210 °F for a train travelling at 20 mph.
For a wheel undergoing braking, the wheel temperature will increase in direct proportion to an increase in brake retarding force and/or speed. Using the calculated brake retarding force of 589 pounds that resulted in a WTD temperature reading of 210 °F at 20 mph, and given the known speed and temperature of the L3 wheel, further calculation determined that the brake retarding force on the wheel at Komo was approximately 1017 pounds.
Specifically, for an increase in speed from 20 mph (CP potash train WTD data point) to 30 mph (occurrence train WTD data point), the higher speed theoretically yields an increase in temperature from 210 °F to 315 °F at 30 mph, (i.e., 210 °F x 30 mph / 20 mph). Additionally, for the calculated brake retarding force of 1017 pounds, the wheel temperature theoretically further increases from 315 °F to 544 °F (i.e., 315 °F x 1017 pounds / 589 pounds), the L3 temperature recorded at Komo. It is worth mentioning that any inherent inaccuracies in these estimates are considered minimal given the relatively small changes in speed (10 mph) and brake retarding force (428 pounds) used in the calculations.
The estimated brake retarding force of 1017 pounds on the L3 wheel at Komo was then used to calculate the brake retarding force and the BHP for the entire trip. The calculations took the following considerations into account:
- There were no valid wheel temperature readings taken before Komo. However, assuming, for simplicity, that minimal brake shoe wear occurred between Boston Bar and Komo, it can be concluded that, for the first leg of the trip, the brake retarding force started at and essentially remained constant at 1017 pounds, starting from the initial departure from Boston Bar.
- After Komo, the temperature readings for the L3 wheel decreased at each subsequent WTD location. Between Komo and Yale, the measured wheel temperature reduced from 544 °F to 299 °F, i.e., to 55%; between Yale and Hope, the measured wheel temperature further reduced at a more gradual rate from 299 °F to 291 °F, representing 53% of the temperature measured at Komo. The decreasing temperatures indicate that the brake retarding force was gradually decreasing, which can be explained by the effects of brake shoe wear.Footnote 59 To account for this in the computation of BHP, the brake retarding force was progressively reduced from 1017 pounds to 599 pounds at a rate of 30 pounds per mile between Komo and Yale, and from 599 pounds (i.e., based on wheel temperature reduction to 55% of 544 °F) to 544 pounds (i.e., reduction to 53% of 544 °F) at a rate of 1 pound per mile between Yale and the location where the train came to a stop after the train-initiated emergency brake application.
The results of these calculations are provided in Table C1. As the table shows, the calculated BHP averaged 50 for the first leg of the trip between Boston Bar and Komo and reached a maximum of 81 around Komo, well in excess of the 30 BHP that 36-inch diameter Class C wheels are designed to withstand. The BHP remained high throughout the trip (1 hour and 46 minutes), with a calculated overall average of 45. The calculated average brake retarding force was 752 pounds between Boston Bar and the location of the train-initiated emergency brake application and, based on this value, the 30 BHP threshold would occur at 15 mph.
| Location | Elapsed time | Mile | Speed (mph) | Estimated brake shoe force* (pounds) | Estimated brake retarding force (pounds) | Calculated brake horsepower | Cumulative average brake horsepower |
|---|---|---|---|---|---|---|---|
| Boston Bar | 00:00:00 | 2.0 | 0.0 | 3178 | 1017 | 0 | 0 |
| Komo | 00:34:29 | 13.8 | 29.8 | 3178 | 1017 | 81 | 50 |
| Stop location after positive reduction | 00:52:58 | 21.2 | 0.0 | 2656 | 850 | 0 | 48 |
| Yale | 01:17:14 | 29.2 | 37.3 | 1747 | 559 | 56 | 39 |
| Hope | 01:38:44 | 42.8 | 38.1 | 1700 | 544 | 55 | 43 |
| Train-initiated emergency brake application | 01:45:08 | 47.7 | 50.5 | 1694 | 542 | 74** | 45 |
| Stop due to emergency brake and derailment | 01:46:27 | 48.3 | 0.0 | 1681 | 538 | 0 | 45 |
* Brake shoe force equals brake retarding force divided by coefficient of brake shoe friction (a conservatively estimated value of 0.32 was used in the calculations).
** Even though the brake retarding force was diminished from the brake shoe wear, the BHP remained high after Hope because the speed had increased.
Not only was the BHP well above the recommended threshold in this occurrence, but the excessive BHP levels were held for extended periods. After departing Boston Bar and until the train-initiated emergency brake application, the train travelled a distance of just over 46 miles in about 1 hour and 46 minutes; it reached a speed of 50 mph when a train-initiated emergency brake application occurred (Figure C1). During this time, train speed exceeded 15 mph for 1 hour and 30 minutes over 44.1 miles.
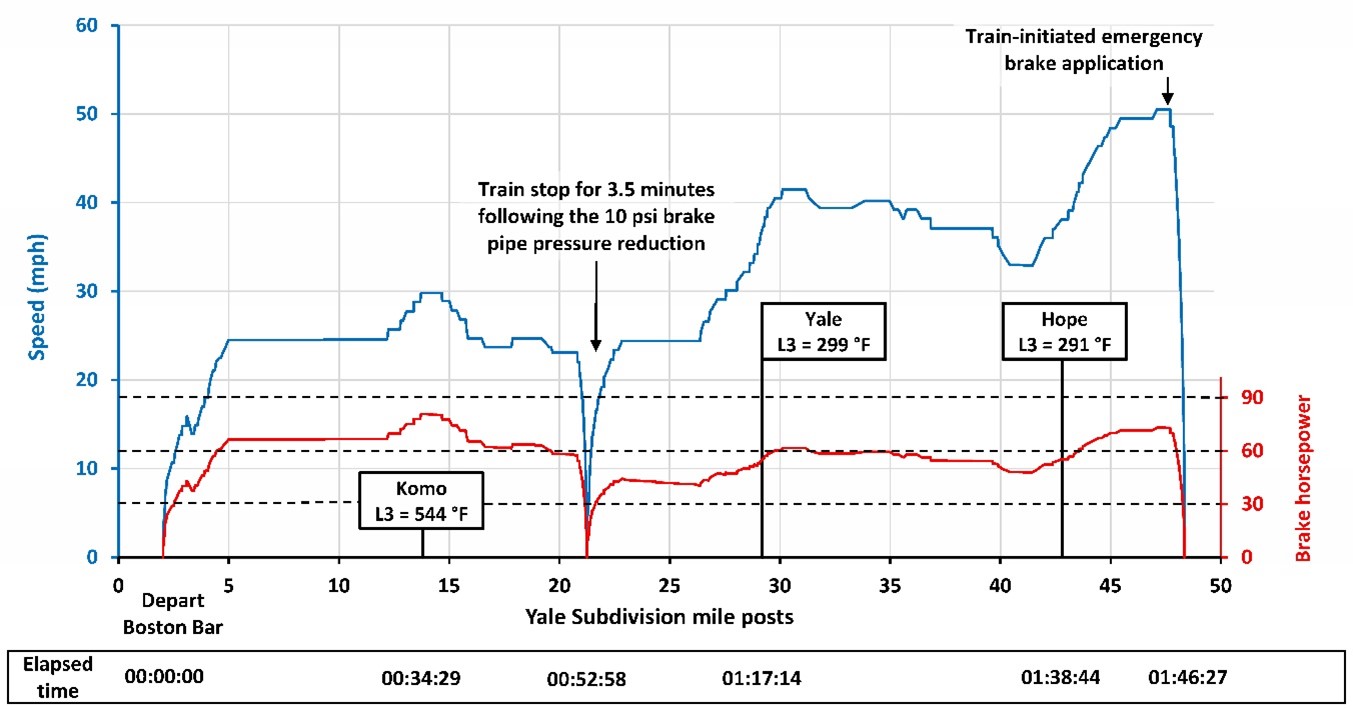
* The graph is based on a constant brake retarding force of 1017 pounds between Boston Bar and Komo. For a fixed amount of brake retarding force, BHP varies directly with speed. Thus, for the first leg of the trip, the profile of the BHP is identical to the profile of the speed. After Komo, to model the effect of accelerated brake shoe wear, a decreasing amount of brake retarding force (and hence brake shoe force) was used in the calculations, and therefore the BHP profile does not exactly follow the speed profile.
The brake retarding force calculations can also be used to calculate the net hand braking ratio,Footnote 60 which can provide insight into whether the elevated wheel temperatures could have been caused by an applied hand brake.
Based on the calculated brake retarding force of 1017 pounds at Komo, the net hand braking ratio at that location would have been about 8.9%,Footnote 61 which is equivalent to a fully applied hand brake and represents a typical value expected for the securement of rolling stock.
Appendix D – Results of drag testing on loaded railcars
On 22 June 2021, drag tests were conducted on a test track at the Canpotex facility in Guernsey, Saskatchewan, to determine if it would have been possible for the wheels of a loaded car, such as car CNPX 3373 in this occurrence, to stop rotating freely when the brakes were applied while the car was being dragged.
The tests were conducted on 3 fully loaded potash cars similar in weight, all built by -National Steel Car in 2005:
- CNPX 3373, the occurrence car
- CNPX 3369, a car of similar design and brake system characteristics as the occurrence car
- CNPX 3361, a car of similar design and brake system characteristics as the occurrence car
The cars measured 47 feet in length and were equipped with 36-inch, Class C wheels.
Before testing, the brake shoes were visually inspected; some were nearly new, while others slightly worn or worn. All hand brakes were tightened and adjusted to obtain 120 pound-foot of torque.
Eight drag tests were performed (Table D1). In the first test, a locomotive pulled the 3 loaded test cars with hand brakes applied, then pushed them back to their original starting location. In subsequent tests, to cover a range of scenarios, different combinations of brakes were used on different cars (hand brakes applied or released; air brakes applied at 10 psi or released; emergency brakes applied or released).
| Test | Brake application on car CNPX 3373 | Brake application on car CNPX 3369 | Brake application on car CNPX 3361 | Push/pull direction | Speed (mph) | Distance travelled | Wheel rotation results |
|---|---|---|---|---|---|---|---|
| 1 | HB*: 120 lb-ft AB**: none |
HB: 120 lb-ft AB: none |
HB: 120 lb-ft AB: none |
Pull westward |
0 to 2 | 1.3 car lengths, 61 feet, 6.5 wheel revolutions |
All wheels rotated freely |
| 2 | HB: 120 lb-ft AB: none |
HB: 120 lb-ft AB: none |
HB: 120 lb-ft AB: none |
Push eastward |
0 to 2 | 1 car length, 42 feet, 4.5 wheel revolutions |
All wheels rotated freely |
| 3 | HB: 120 lb-ft AB: 10 psi |
HB: 120 lb-ft AB: 10 psi |
HB: 120 lb-ft AB: 10 psi |
Pull westward |
0 to 2 | 0.75 car lengths, 38 feet, 4 wheel revolutions |
All wheels rotated freely |
| 4 | HB: 120 lb-ft AB: 10 psi |
HB: 120 lb-ft AB: 10 psi |
HB: 120 lb-ft AB: 10 psi |
Push eastward |
0 to 2 | 1.75 car lengths, 61 feet, 6.5 wheel revolutions |
All wheels rotated freely |
| 5 | HB: 120 lb-ft AB: Emergency |
HB: 120 lb-ft AB: Emergency |
HB: Released AB: Released |
Pull westward |
0 to 2 | 1 car length, 42 feet, 4.5 wheel revolutions |
All wheels rotated freely |
| 6 | HB: 120 lb-ft AB: Emergency |
HB: 120 lb-ft AB: Emergency |
HB: Released AB: Released |
Push eastward |
0 to 2 | 1.75 car lengths, 80 feet, 8.5 wheel revolutions |
All wheels rotated freely |
| 7 | HB: 120 lb-ft AB: Emergency |
HB: 120 lb-ft AB: Released |
HB: Released AB: Released |
Pull westward |
0 to 5 | 17 car lengths, 792 feet, 84 wheel revolutions |
All wheels rotated freely |
| 8 | HB: 120 lb-ft AB: Emergency |
HB: Released AB: Released |
HB: Released AB: Released |
Push eastward |
0 to 7 | 11 car lengths, 509 feet, 54 wheel revolutions |
All wheels rotated freely |
* Hand brake
** Air brake
For all the tests conducted, the wheel sets on all 3 loaded cars rotated freely without any indication of locking up, impending wheel lockup, or sliding, whether momentarily or continuously. These results are consistent with industry common knowledge and experience.
Appendix E – Examination and testing of the brakes on car CNPX 3373
To help determine if the condition of the brakes on car CNPX 3373 may have contributed to the derailment, the air brake system and the hand brake on car CNPX 3373 underwent a series of tests. Information on the tests performed and the results obtained is provided below.
Single car test
On 14 September 2020, Canadian National Railway Company (CN) conducted a single car air brake test at Thornton Yard, in Vancouver. This test verifies that a freight car’s air brake condition and functionality meet the requirements of Association of American Railroads Specification S-486, Code of Air Brake System Tests for Freight Equipment – Single Car Test.
Car CNPX 3373 passed the test.
Brake shoe force test
On 18 September 2020, CN conducted brake shoe force testsFootnote 62 at its facilities in Thornton Yard. These tests measured the brake shoe force at each of the freight car wheels on car CNPX 3373. Two series of tests were performed, one using the air brake system (Table E1) and the other one using the hand brake (Table E2), to determine the net braking ratios and the distribution of the brake shoe forces on the wheels.
Both series of tests confirmed that the brake shoe forces were normally distributed on all the car’s wheels and within expected ranges.
From these results, it can be concluded that the air brake and hand brake systems were operating properly and there was no excessive brake application at any one of the wheel positions.
These tests also indicated that the total brake shoe force on the A-end was slightly higher than on the B-end. This was by design from the car manufacturer to compensate for the loss of efficiency of brake shoe forces on the A-end due to brake rigging linkages of levers and rods.Footnote 63 The brake shoe forces were, on average, 5.8% higher on the right side of the railcar.
| Test | Test parameters | Shoe force (pounds) | Calculated braking ratio (Percentage) | ||||||||
|---|---|---|---|---|---|---|---|---|---|---|---|
| B-end wheels | A-end wheels | Total | |||||||||
| L1 | L2 | R1 | R2 | L3 | L4 | R3 | R4 | ||||
| 1 | Full-service brake application, BCP* of 65 psi | 2407 | 2628 | 2498 | 3030 | 2384 | 3079 | 2639 | 2991 | 21 656 | 7.6 |
| 2 | Full-service brake application, BCP of 65.6 psi | 2420 | 2613 | 2512 | 3054 | 2527 | 3115 | 2695 | 3027 | 21 963 | 7.7 |
| 3 | Full-service brake application, BCP of 65.5 psi | 2451 | 2635 | 2523 | 3068 | 2608 | 3122 | 2932 | 3088 | 22 427 | 7.8 |
| 4 | Emergency brake application, BCP of 76 psi | 2970 | 3089 | 3006 | 3538 | 3043 | 3549 | 3434 | 3708 | 26 337 | 9.2 |
* BCP stands for brake cylinder pressure.
| Test | Test parameters | Shoe force (pounds) | Calculated braking ratio (percentage) | ||||||||
|---|---|---|---|---|---|---|---|---|---|---|---|
| B-end wheels | A-end wheels | Total | |||||||||
| L1 | L2 | R1 | R2 | L3 | L4 | R3 | R4 | ||||
| 1 | Hand brake application* | 2600 | 2752 | 2660 | 3199 | 2770 | 3228 | 3089 | 3368 | 23 666 | 8.3 |
| 2 | Hand brake application | 3086 | 3215 | 3178 | 3676 | 3335 | 3890 | 3587 | 3685 | 27 652 | 9.7 |
| 3 | Hand brake application | 1899 | 2186 | 2128 | 2554 | 2098 | 2554 | 2239 | 2397 | 18 055 | 6.3 |
| 4 | Hand brake application | 4324 | 4243 | 4322 | 4764 | 4357 | 4953 | 4734 | 4948 | 36 645 | 12.8 |
* During the hand brake applications, the brake cylinder pressure was 0 psi.
Visual examination of the hand brake
The TSB performed a visual examination of the hand brake. There was some minor localized deflection (a small dent) to the hand wheel. There was very little wear in the axle bushings, and the ratchet spring was present.
The hand brake mechanism appeared to be functioning from a benchtop perspective. The fact that the hand brake was operational was confirmed during further inspection and testing at a third-party facility.
Further inspection and testing
On 04 November 2020, the air brake system and the hand brake were further examined and tested at a Canpotex facility in Guernsey, Saskatchewan. The tests were conducted by a TSB investigator with the assistance of 2 Canpotex managers. The tests were performed on the empty car CNPX 3373, with the original hand brake assembly and the 8 wheel locations on the car equipped with high-friction composition brake shoes.
Inspection and testing included the following tasks:
- Inspect the brake shoes and brake rigging
- Verify the condition and operation of the slack adjuster
- Test the operation of the hand brake system, air brake system, and various combinations of the two, with the brakes applied and subsequently released, checking for any potential malfunction and/or bindingFootnote 64
The results did not indicate any structural, mechanical, or performance issues that would have interfered with the proper and expected operation of the hand brake or air brake system on car CNPX 3373.
In addition to the above testing and inspection, the brake rigging’s horizontal lever on the A-end of the car was further examined and compared to the horizontal lever on a car of identical design and brake system characteristics (car CNPX 3369, built in 2005 by National Steel Car). The purpose was to determine whether the horizontal lever on the A-end of car CNPX 3373 was potentially binding on a structural member of the car. Based on the examination of both cars, it was determined that the horizontal lever was loosely resting, by design, on the car’s structural member and moved free of any binding or resistance when the brakes were applied or released.