Runway overrun
WestJet Airlines Ltd.
Boeing 737-8CT, C-FUJR
Halifax/Stanfield International Airport, Nova Scotia
The Transportation Safety Board of Canada (TSB) investigated this occurrence for the purpose of advancing transportation safety. It is not the function of the Board to assign fault or determine civil or criminal liability. This report is not created for use in the context of legal, disciplinary or other proceedings. See Ownership and use of content. Masculine pronouns and position titles may be used to signify all genders to comply with the Canadian Transportation Accident Investigation and Safety Board Act (S.C. 1989, c. 3).
Summary
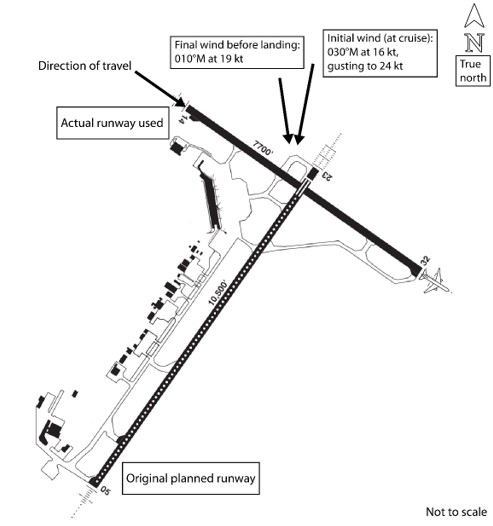
On 05 January 2020, the WestJet Airlines Ltd. Boeing 737-8CT aircraft (registration C-FUJR, serial number 60130), operated as flight WJA248, was conducting an instrument flight rules flight from Toronto/Lester B. Pearson International Airport, Ontario, to Halifax/Stanfield International Airport, Nova Scotia, with 172 passengers and 6 crew members on board. The flight crew had originally planned for an approach for Runway 05 at the Halifax/Stanfield International Airport. However, approximately 14 minutes before landing, due to lowering ceiling and reduced visibility, they requested to change to the Runway 14 instrument landing system approach. At 1207 Atlantic Standard Time, the aircraft touched down with a tailwind component on the wet, snow-covered runway. Following touchdown, the aircraft could not be stopped and it overran the end of Runway 14. The aircraft came to rest in snow with the nose wheel approximately 300 feet (91 m) beyond the runway end. There were no injuries and no damage to the aircraft. There was no post-impact fire, and the emergency locator transmitter did not activate.
1.0 Factual information
1.1 History of the flight
At 1017Footnote 1 on 05 January 2020, the WestJet Airlines Ltd. (WestJet) Boeing 737-8CT aircraft (registration C-FUJR, serial number 60130), operated as WJA248, departed Toronto/Lester B. Pearson International Airport (CYYZ), Ontario, for an instrument flight rules flight to Halifax/Stanfield International Airport (CYHZ), Nova Scotia, with 172 passengers and 6 crew members on board. The captain was the pilot flying (PF) and the first officer was the pilot not flying (PNF).
While en route, the flight crew obtained the weather for CYHZ, which had been issued at 1100, and indicated the following:
- winds from 030° magnetic (M) at 16 knots, gusting to 24 knots;
- visibility 1 ¼ statute miles (SM) in light snow;
- ceiling overcast at 300 feet above ground level (AGL);
- temperature −0 °C;
- dew point −0 °C; and
- altimeter 29.15 inches of mercury (inHg).
The area navigation (RNAV) approaches to Runway 05 were in use, and the Runway 14 instrument landing system (ILS) approach was available. These reported winds, including the gusts, would result in a headwind component of 22 knots for Runway 05 or a tailwind component of 9 knots for Runway 14.Footnote 2
The flight crew programmed the arrival and RNAV required navigation performance (RNP) approach for Runway 05 into the flight management computer (FMC). They then obtained the landing distance for Runway 05 via the aircraft communications addressing and reporting system (ACARS), which indicated a required distance of 7234 feet with flaps set to 30 and the autobrake system set to 3.Footnote 3 The flight crew calculated the landing reference speed (Vref) to be 147 knots based on the aircraft’s weight and flap setting and, with the wind additive, they calculated their target approach speed to be 162 knots.Footnote 4
At 1127, the airport issued a runway surface condition (RSC) report that indicated that the middle 160 feet of both 200-foot-wide runways were 100% covered in a trace of wet snow, and the remaining widths were 100% covered in 2 inches of wet snow.
At 1143, the crew obtained updated weather through the ACARS. The automatic terminal information service (ATIS)Footnote 5 information Mike,Footnote 6 which had been issued at 1130, indicated that the visibility had decreased to 5/8 SM in light snow and the ceiling had lowered to 200 feet AGL. Moderate turbulence was also reported between 1000 feet AGL and 3000 feet AGL.
At 1153, approximately 14 minutes before landing, the flight crew was advised by the Moncton area control centre controller (centre controller) that the ceiling was 200 feet AGL and the winds were from 020°M at 17 knots, gusting 27 knots. Since the ceiling was below the landing minima for the RNAV (RNP) approach to Runway 05, the flight crew requested the Runway 14 ILS approach, which provides lower landing minima. They then switched to the CYHZ terminal controller frequency.
At 1155, when the aircraft was about 45 nautical miles (NM) from CYHZ and descending through 13 000 feet above sea level, the flight crew was cleared for the ILS approach to Runway 14 and was instructed to proceed to the intermediate fix TETAR (Appendix A).
While preparing for the runway change, the flight crew members mentally assessed that the wind for Runway 05 would result in a crosswind for Runway 14 because the runways were perpendicular to each other. Based on their wind assessment, the flight crew believed that Runway 14 was of sufficient length for landing and did not request new ACARS data, nor did they revise their target approach speed from what they had calculated for Runway 05. However, the winds actually resulted in a 15-knot tailwind component on Runway 14, which went unnoticed by the flight crew and exceeded WestJet’s maximum tailwind for landing of 10 knots.Footnote 7
Due to the change of runway, the flight crew’s workload increased as they prepared for the new approach by reprogramming the FMC and completing the setup for the ILS approach to Runway 14.
While the aircraft was in descent to CYHZ, the airport snowplows were conducting snow removal operations on Runway 14. The vehicles were on the runway from about 1105 to 1154, at which point they went to remove the snow from Runway 05.
At 1201, approximately 6 minutes before landing, the terminal controller informed the flight crew that the runway visual range (RVR) was 4000 feet and the lights were set to 5Footnote 8 and then instructed them to switch to the CYHZ tower frequency.
As the aircraft was approaching the intermediate fix TETAR, the flight crew checked in with the tower controller, who informed them that the winds were from 010°M at 14 knots, gusting to 23 knots, and the RVR was 4000 feet. The flight crew asked for any braking action reports from other aircraft. Because all recent landings had been carried out on Runway 05, no braking action reports were available for Runway 14.
The flight crew conducted the low-visibility approach checklist, even though not required as the visibility was greater than ½ SM.
At 1203, when the aircraft was 9.6 NM from CYHZ, it intercepted the ILS to Runway 14. At this point, the aircraft’s indicated airspeed and groundspeed were 186 knots and 194 knots, respectively, and the flaps were set to 5. At the same time, approximately 4 minutes before landing, the tower controller informed the flight crew that the winds were from 020°M at 17 knots, gusting to 23 knots, and then cleared the aircraft to land on Runway 14.
The flight crew flew a stable approach, and configured the aircraft with the landing gear down and the flaps set to 30 by the final approach fix IMANO, which is 4.1 NM from the runway threshold. The airspeed was 163 knots and the groundspeed was 171 knots.
On approach, the aircraft encountered gusty winds, creating light to moderate turbulence and producing a tailwind that fluctuated between 10 and 15 knots. The autopilot was engaged and the aircraft encountered minor glideslope deviations.
Approximately 1 minute before landing, the tower controller provided the final wind check, informing the flight crew that the winds were from 010°M at 19 knots (Figure 1). The flight crew continued the approach, without awareness that the winds resulted in a 13-knot tailwind component.
At 1206:43, the aircraft reached the decision height of 200 feet AGL. The crew had the runway in sight and continued with the landing. Seven seconds later, while on short final and approximately 100 feet above the threshold height, the PF disengaged the autopilot. At 1206:54, due to the gusty conditions, the aircraft descended below the glideslope with a descent rate that was high enough for the enhanced ground proximity warning system (EGPWS) to issue a “SINK RATE” aural alert just before the aircraft entered the flare. At 1206:55, the aircraft crossed the threshold at a height of 35 feet AGL. During the flare, the airspeed fluctuated between 160 knots and 164 knots.
At 1206:59, the aircraft touched down approximately 1200 feet from the threshold of Runway 14 with a groundspeed of 173 knots. Upon touchdown, the speedbrakes and thrust reversers deployed. The autobrake system activated for 8 seconds after touchdown, providing an average deceleration of 7.5 ft/s2, which is consistent with autobrake 3 selection. Maximum reverse thrust was reached at 1207:06, as the aircraft was decelerating through 144 knots groundspeed, with 4400 feet of runway remaining.
At 1207:09, with approximately 4000 feet of runway remaining, the PF determined that the aircraft was not decelerating as anticipated, and applied manual braking, which disengaged the autobrakes. Given the left-hand crosswind, asymmetric braking was applied, with maximum braking on the right, to maintain alignment with the centreline.
At 1207:11, the antiskid system activated due to the runway conditions, and likely remained active for the remainder of the rollout.
At 1207:23, when the aircraft was decelerating through 68 knots groundspeed (60 knots airspeed), with 1700 feet of runway remaining, the reverse thrust levers were brought to idle, as per company standard operating procedures,Footnote 9 and the PF reduced the amount of braking.
At 1207:32, the PF recognized that the aircraft was not slowing down enough to make the turn for the taxiway at the end of the runway and re-applied maximum braking effort. However, because the antiskid system was likely active, the increased brake pressure had no effect on the deceleration. At 1207:42, maximum reverse thrust was applied when the aircraft’s groundspeed was 30 knots, and approximately 200 feet of runway remained.
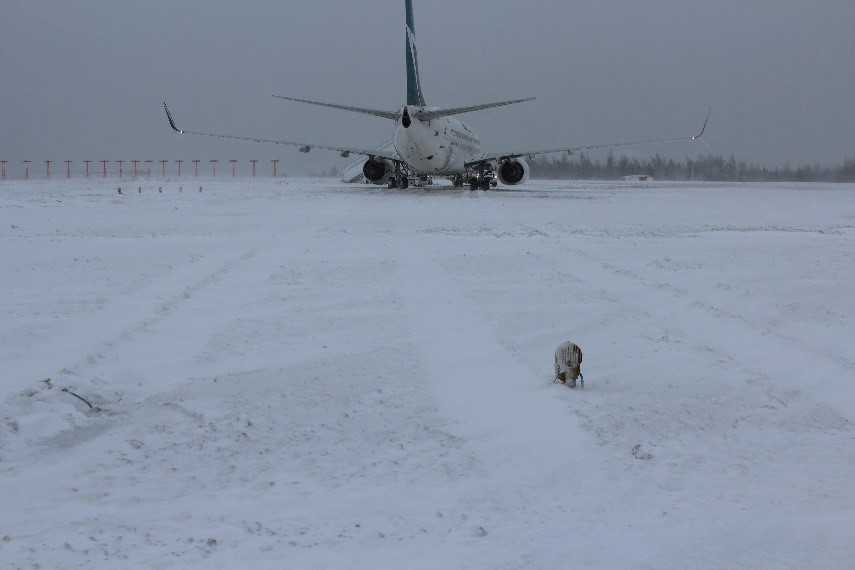
At 1207:45, the aircraft continued beyond the end of the runway at 26 knots. It came to a complete stop approximately 300 feet (91 m) past the end of the runway, on the snow-covered grass, and within the runway end safety area (RESA)(Figure 2).
Once stopped, the flight crew advised the tower controller that the aircraft had gone off the end of the runway and aircraft rescue and fire fighting (ARFF) were dispatched. When ARFF arrived on scene, they reported that the aircraft was not visibly damaged.
Since there were no injuries, the passengers and crew remained onboard the aircraft until busses arrived to transport them to the terminal. The first bus arrived at 1244 and the last of the passengers disembarked at 1415. The crew disembarked shortly thereafter.
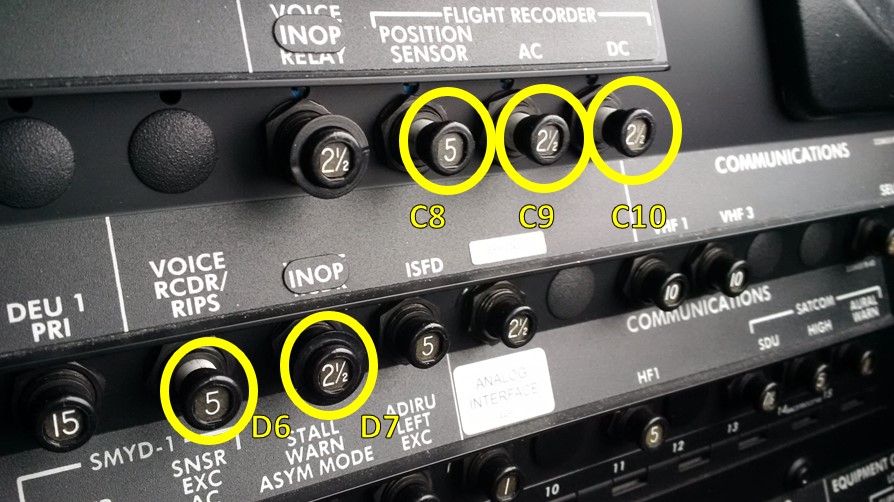
While waiting for buses, flight crew were busy coordinating with the company and the tower. The flight crew received an ACARS message from the maintenance controller to remove electrical power to the cockpit voice recorder (CVR) and flight data recorder (FDR) by pulling circuit breakers C7, C8, C9, and C10.Footnote 10 The flight crew pulled the circuit breakers specified in the maintenance message; however, on this aircraft, the actual CVR circuit breaker was located at D6. Therefore, the CVR continued to be powered and the recording of the approach and landing was overwritten.
The emergency locator transmitter (ELT) did not activate during the landing sequence.
1.2 Injuries to persons
There were no injuries.
1.3 Damage to aircraft
There was no damage to the aircraft. As a precaution, WestJet maintenance replaced the tires and brakes before returning the aircraft to service.
1.4 Other damage
Two runway end lights were damaged when they were struck by the main landing gear.
1.5 Personnel information
| Captain | First officer | |
|---|---|---|
| Pilot licence | Airline transport pilot licence (ATPL) | ATPL |
| Medical expiry date | 30 May 2020 | 31 January 2021 |
| Total flying hours | 30 000+ | 2275 |
| Flight hours on type | 7500 | 75 |
| Flight hours in the 7 days before the occurrence | 0 | 0 |
| Flight hours in the 30 days before the occurrence | 58.1 | 58.2 |
| Flight hours in the 90 days before the occurrence | 154.1 | 58.2 |
| Flight hours on type in the 90 days before the occurrence | 154.1 | 58.2 |
| Hours on duty before the occurrence | 3.5 | 3.5 |
| Hours off duty before the work period | 72+ | 72+ |
The flight crew were certified and qualified for the flight in accordance with existing regulations.
The captain had been flying at WestJet for over 10 years, and had upgraded to captain in September 2017. He completed an annual pilot proficiency check (PPC) and crew resource management (CRM) and threat and error management (TEM) training in April 2019.
The first officer started working at WestJet in October 2019, and completed his initial training, including a PPC and line indoctrination, in December 2019. The first officer completed CRM and TEM training in November 2019.
Based on a review of the flight crew’s work and rest schedule, fatigue was not considered a factor in this occurrence.
1.6 Aircraft information
| Manufacturer | Boeing |
|---|---|
| Type, model and registration | 737-8CT, C-FUJR |
| Year of manufacture | 2015 |
| Serial number | 60130 |
| Certificate of airworthiness/flight permit issue date | 27 March 2015 |
| Total airframe time | 17 761.0 hours |
| Engine type (number of engines) | CFM International, Turbo Fan Engine, CFM56-7B27E (2) |
| Propeller/Rotor type (number of propellers) | N/A |
| Maximum allowable take-off weight | 79 015.70 kg |
| Recommended fuel type(s) | Kerosene Jet A, Jet A-1, JP-5, JP-8 |
| Fuel type used | Jet A |
1.6.1 General
The 737-8CT model designation describes a Boeing 737 Next Generation airliner built for WestJet.Footnote 11 The occurrence aircraft was configured for 174 passengers.
Records indicate that the aircraft was operated within its weight and centre-of-gravity limits at the time of the occurrence.
Deceleration of the 737-800 series aircraft on the runway typically incorporates the combined effects of main wheel braking, engine thrust reverse, and speedbrakeFootnote 12 systems.
In this occurrence, these systems functioned as designed and there was no indication that an aircraft system malfunction played a role in the runway overrun. The aircraft’s tires were found to have acceptable tire tread depth and were not damaged. The mainwheel brakes were determined to be within serviceable limits.
1.6.2 Antiskid protection
Antiskid protection controls the amount of hydraulic pressure applied by the pilots on the brakes in order to prevent a wheel from skidding.Footnote 13 Antiskid provides the maximum allowable braking effort for the runway surface in use, minimizing tire wear and optimizing braking distance. Antiskid protection is provided in the normal and alternate brake systems.
When the antiskid system senses an impending skid condition, it adapts to the runway conditions by modulating the brake pressure to each wheel to obtain optimal braking effectiveness. While the antiskid system is active, the commanded brake pressureFootnote 14 is equal to or greater than the brake pressure governed by the antiskid valve.
1.6.3 Autobrake system
The autobrake system uses hydraulic system pressure to provide maximum deceleration in the event of a rejected takeoff, and automatic braking at preselected deceleration rates immediately after touchdown. The system operates only when the normal brake system is functioning and antiskid system protection is provided during autobrake operation.
Four levels of deceleration can be selected for landing.Footnote 15 After landing, autobrake application begins when both forward thrust levers are retarded to IDLE and the main wheels spin up.
To maintain the selected landing deceleration rate, autobrake pressure is reduced as other controls, such as thrust reversers and speedbrakes, contribute to total deceleration. The deceleration level can be changed (without disarming the system) by rotating the selector. The autobrake system will bring the aircraft to a complete stop unless the pilot disarms the system.
Pilots can disarm the autobrake system by moving the selector switch to the OFF position or by doing any of the following:
- moving the speedbrake lever to the DOWN detent;
- advancing the forward thrust lever(s), except during the first 3 seconds after touchdown; or
- applying manual brakes.
1.6.4 Enhanced ground proximity warning system
The aircraft was equipped with a Honeywell Mark V-A EGPWS. The EGPWS provides warnings that alert the crew of the aircraft’s proximity to the ground. A “SINK RATE” aural alert indicates that there is an excessive descent rate.
According to WestJet’s Quick Reference Handbook (QRH), if crew are flying under daylight visual meteorological conditions and can verify that no terrain or obstacle hazard exists, they may regard the alert as cautionary and carry on with the approach.Footnote 16
In this occurrence, due to the combination of airspeed and tailwind, a descent rate of around 930 fpm was required to maintain the glideslope. The gusty conditions created a momentary descent rate, for that altitude, that exceeded the “SINK RATE” threshold of 1075 fpm (see section 1.17.2 for discussion on stabilized approaches).
1.7 Meteorological information
Before departure, the flight crew received the aerodrome forecast (TAF) for CYHZ that had been issued at 0740 on 05 January 2020 and was valid for the 24-hour period starting at 0800. The TAF indicated the following conditions between 0800 and 1300:
- winds from 050° true (T) at 12 knots;
- visibility 6 SM in light snow;
- overcast ceiling at 800 feet AGL.
Between 0800 and 1300, there would be the following temporary change in conditions:
- visibility 2 SM in light snow;
- overcast ceiling at 200 feet AGL.
During the flight, the flight crew received the weather updates listed in Table 3.
| Source | Time when shared with crew | Wind (Direction/ speed) | Visibility | Ceiling (AGL) |
Temp (°C) |
Dew point (°C) |
Altimeter (inHg) |
|---|---|---|---|---|---|---|---|
| ATIS Lima (issued at 1100) | between 1100 and 1130 | 030°M/16 kt, gusting to 24 kt | 1 ¼ SM in light snow | Overcast at 300 feet | −0 | −0 | 29.15 |
| ATIS Mike (issued at 1130) | 1143 (ACARS) | 020°M/16 kt, gusting to 23 kt | 5/8 SM in light snow | Overcast at 200 feet | −0 | −0 | 29.14 |
| Centre (weather report issued at 1149) | 1153 | 020°M/17 kt, gusting to 27 kt | ½ SM in snow | Overcast at 200 feet | −0 | −0 | 29.12 |
| Terminal | 1155 | Not provided | Runway 14 RVR 3500 feet* | Not provided | Not provided | Not provided | Not provided |
| Terminal | 1157 | Not provided | Runway 14 RVR 4500 feet** | Not provided | Not provided | Not provided | Not provided |
| Terminal | 1201 | Not provided | Runway 14 RVR 4000 feet** | Not provided | Not provided | Not provided | Not provided |
| Tower | 1201 | 010°M/14 kt, gusting to 23 kt | Runway 14 RVR 4000 feet** | Not provided | Not provided | Not provided | 29.12 |
| Tower (reporting the hourly weather) | 1203 | 020°M/17 kt, gusting to 23 kt | ½ SM in snow | Overcast at 200 feet | −0 | −0 | Not provided |
| Tower (when cleared to land) | 1204 | 020°M/17 kt, gusting to 23 kt | Not provided | Not provided | Not provided | Not provided | Not provided |
| Tower (final wind check) | 1206 | 010°M/19 kt | Not provided | Not provided | Not provided | Not provided | Not provided |
* At this time, the lights were set to 4.
** At this time, the lights were set to 5.
1.8 Aids to navigation
The following instrument approaches are available at CYHZ:
- RNAV, global navigation satellite system (GNSS) and RNP, for all 4 runways;
- Localizer for Runway 05;
- Category I and II ILS for Runway 23; and
- Category I ILS for Runway 14.
There were no reported outages of navigational aids at the time of the occurrence flight’s approach and landing on Runway 14.
The occurrence aircraft was equipped with the appropriate navigational aids to conduct an ILS approach, and these aids were serviceable at the time of the occurrence.
1.9 Communications
Not applicable.
1.10 Aerodrome information
CYHZ has 2 runway surfaces: Runway 05/23 (053°M/233°M), which is 10 500 feet in length with an asphalt/concrete surface, and Runway 14/32 (143°M/323°M), which is 7700 feet in length with an asphalt surface; both surfaces are 200 feet wide.
Runway 14 has a RESA that extends to 150 m (492 feet) past the runway end and has an average downward slope of 0.2%. These features meet Transport Canada’s (TC) and the International Civil Aviation Organization’s (ICAO) standards for a 150 m (492 feet) RESA.
Approximately 166 m (544 feet) past the end of Runway 14, there is a significant drop of 2.8 m (9 feet), with a downward slope of 73%. This slope does not meet ICAO’s recommendations for a 5% longitudinal slope for a RESA that extends to 300 m (984 feet) past the runway end.
Runway 14 has an average positive slope of about 0.54%. On touchdown, the red runway end lights are not visible because they are obscured by the rising elevation of the runway. Considering the geometry of the runway elevation and the pilot’s eye height, the point at which the occurrence pilots could have established visual line-of-sight with the lights was at about 2600 feet from the end of the runway, about 2/3 down the runway.
In this occurrence, the aircraft had travelled past this point before maximum braking effort was reduced.
1.10.1 Runway distance remaining cues
Various visual cues are available to assist pilots in determining their position on a runway when taking off and landing. Some of these cues are required based on the type of approach; for example, a Category II ILS approach requires runway centreline lighting.
At CYHZ, Runway 23 is equipped with a Category II ILS approach, and therefore, has runway centreline lighting installed. The centreline lights are white up to a point 3000 feet from the runway end. They then alternate between red and white up to a point 1000 feet from the runway end, and are red for the last 1000 feet. This lets pilots know the length of runway remaining. Runway 14/32 is not equipped with centreline lighting, nor is it required to be, based on the approaches available.
Runway distance remaining signs are another example of cues to assist pilots. These signs are used in the United States and at most Canadian military airports, and are installed at 1000-feet intervals along the runway indicating the distance remaining to the end of the runway. The runways at CYHZ are not equipped with runway distance remaining signs nor are they required to be by regulation. If an airport operator chooses to provide the signs, the standards that must be followed are included TC’s Aerodrome Standards and Recommended Practices.Footnote 17
1.10.2 Runway surface condition
At 1127, the reported RSC for Runway 05/23 and Runway 14/32 was as follows:
- Cleared width of 160 feet, 100% covered in a trace of wet snow; remaining widths, 100% covered in 2 inches of wet snow.
Following the occurrence, at 1237, the RSC was reported as follows:
- Runway 05/23:
- Cleared width of 160 feet, 100% covered in a trace of wet snow;
- Remaining width, 100% covered in 2 inches of wet snow;
- Runway 14/32:
- Cleared width of 160 feet, 100% covered in 1/8 inch of wet snow;
- Remaining width, 100% covered in 2 inches of wet snow.
A Canadian Runway Friction Index (CRFI) Footnote 18 measurement was neither conducted nor issued by airport staff because it is not considered valid when conditions indicate wet snow. Footnote 19
1.10.3 Analysis for additional navigational aids at Halifax/Stanfield International Airport
The precision capability of an ILS approach allows flight crews to descend to a lower altitude before having to acquire visual references to continue to a landing. An ILS is a ground-based system.
The TSB has previously conducted an investigation at the CYHZ airport that involved aircraft landing with a tailwind in order to conduct an ILS approach.Footnote 20
The TSB also conducted an investigation into an occurrence where an Airbus A320 aircraft touched down short of the runway after flying a non-precision approach to Runway 05 at CYHZ.Footnote 21 That investigation report discussed an analysis conducted by NAV CANADA in 1998 to determine the feasibility of installing an ILS for Runway 05. The results indicated that there would be very little improvement in airport accessibility compared to the high costs of installation. In January 1999, the analysis results were presented at the Air Navigation System National Advisory Committee (ANSNAC), which stated that an ILS would be installed on a cost-recovery basis. However, no further action was taken because there was no agreement from customers to proceed on a cost-recovery basis.
In 2019, the Halifax International Airport Authority (HIAA) contacted NAV CANADA and various air carriers as part of its preparation of a new 20-year Master Plan to discuss anticipated infrastructure requirements, including navigational aids. During these discussions, there was no intention or request to install an ILS on Runway 05 or Runway 32.
Another approach available to pilots that provides ILS-like guidance to similar minima is the RNAV (GNSS) approach to localizer performance with vertical guidance (LPV) minima.
At CYHZ, LPV minima are 200 feet AGL for runways 14, 23, and 32, and 250 feet AGL for Runway 05.
LPV minima are not authorized at WestJet.Footnote 22 The required equipment for an approach to LPV minima includes a GPS (global positioning system) with wide area augmentation system (WAAS) capability, which the company does not have installed in its aircraft. The LPV option was not available on WestJet’s Boeing fleet of aircraft when they were acquired by WestJet.
1.11 Flight recorders
The aircraft was equipped with a solid-state FDR and a solid-state CVR. The CVR and the FDR were sent to the TSB Engineering Laboratory in Ottawa, Ontario, and were downloaded successfully.
The FDR recorded and stored more than 26 hours of flight data, including the occurrence flight.
The CVR recorded and stored the last 2 hours of cockpit sounds, which included only audio recorded on the ground following the incident. Because the CVR continued to be powered after the runway overrun, the recording of the incident was overwritten.
1.11.1 Preservation of aircraft recordings after an incident
In accordance with the Commercial Air Services Standards, a Company Operations Manual (COM) must contain FDR and CVR procedures.Footnote 23 TC’s Advisory Circular (AC) 700-013: Procedures and Training for the Preservation of Aircraft Recorded Data, further explains that it is expected that these procedures include the appropriate steps to follow to disable an FDR and/or a CVR after an accident or incident.Footnote 24
According to the WestJet COM, if data preservation is warranted following an accident or incident, disabling the FDR/CVR circuit breakers upon completion of the flight may be required.Footnote 25 Disabling the applicable circuit breakers removes electrical power from the recorder. For the occurrence aircraft, the location of the circuit breakers were described in the COM to be in electrical system panel 18-2. The FDR circuit breakers are in Row C, and the CVR circuit breakers are in Row D.Footnote 26
Maintenance controllers use a number of documents to complete their work. One such document is the Fault Isolation Manual (FIM),Footnote 27 which describes the procedures to identify and respond to reported faults. The FIM provides information for multiple aircraft models and system configurations; therefore, task procedures are identified with a reference number based on the aircraft configuration to which the FIM task applies.
In this occurrence, the maintenance controller overheard the flight crew communications with dispatch, and retrieved the FIM sections with the procedures related to a CVR faultFootnote 28 and an FDR fault.Footnote 29 Although these sections did not give specific tasks related to disabling CVR and FDR recorders following an occurrence, the tasks did identify where the circuit breakers related to these systems could be found.
The CVR task lists the circuit breakers on the captain’s electrical system panel P18-2, and identifies the primary circuit breakers related to the voice recorder system as D6 or D7, depending on aircraft reference number. On the occurrence aircraft, the applicable circuit breaker was located at D6 (Figure 3).
The FDR task lists the circuit breakers on the captain’s electrical system panel P18-2, and identifies circuit breakers related to the flight recorder as C8, C9, and C10 (Figure 3).
The maintenance controller typed an ACARS message to the occurrence aircraft, advising the flight crew to pull the FDR and CVR circuit breakers, and mistyped the locations as P18-2 C7 and C8 (rather than D6 and D7), and P18-2 C8, C9, and C10.
The PF followed the instructions from the maintenance controller, and disabled the circuit breakers as indicated in the ACARS message. The flight crew did not reference the COM.
1.12 Wreckage and impact information
Not applicable.
1.13 Medical and pathological information
Not applicable.
1.14 Fire
Not applicable.
1.15 Survival aspects
Not applicable.
1.16 Tests and research
1.16.1 TSB laboratory reports
The TSB completed the following laboratory reports in support of this investigation:
- LP004/2020 – FDR Analysis
- LP005/2020 – CVR Download
1.17 Organizational and management information
1.17.1 WestJet Airlines Ltd.
WestJet holds an air operator certificate and operates in accordance with Subpart 705 of the Canadian Aviation Regulations (CARs). The company also holds an approved maintenance organization certificate. Its maintenance activities are conducted in accordance with Subpart 573 of the CARs.
The company provides both scheduled and non-scheduled domestic and international flight services from Canada and abroad. At the time of the occurrence, its fleet consisted of 126 aircraft of various types, including Boeing 737-600, -700, -800 and -8 series aircraft, Boeing 767-300, and Boeing 787-9 aircraft.
WestJet has a TC-approved safety management system (SMS) and has incorporated the SMS into its existing manuals.
WestJet provides CRM training, which includes strategies to help avoid, trap, and manage operational threats and crew errors (TEM).
1.17.2 Stabilized approach
WestJet requires that the aircraft be in stabilized flight no later than 1000 feet above field elevation. A stabilized approach is defined in WestJet’s Flight Operations Manual (FOM) as:
- Aircraft in the final landing configuration;
- Power setting appropriate for aircraft configuration;
- Airspeed no greater than target + 20 knots and trending towards target; and
- On glidepath, gradient path or assumed 3° glidepath.Footnote 30
The FOM also advises pilots to avoid descent rates above 1000 fpm, and requires pilots to perform a go-around if an approach becomes unstable below 1000 feet above field elevation.Footnote 31
In this occurrence, although the flight crew received a “SINK RATE” aural alert, the aircraft met the parameters of a stabilized approach. The PF reacted to the caution by increasing the thrust levers; however, this had a minimal impact on the speed and profile of the aircraft.
1.17.3 Approach planning
According to the FOM, when planning the approach, pilots are expected to obtain the latest weather, verify waypoints and altitudes, and set up the navigation system.Footnote 32 The FOM also states:
Pilots shall determine the required landing distance using established procedures outlined in QRH – Performance Inflight – General section in conjunction with: the ACARS Landing Distance Calculator, the Takeoff and Landing Report (TLR) Landing data, and/or the performance tables in QRH – Performance Inflight.
After determining the required landing distance, confirm:
- Runway distance available exceeds landing distance requirements;
- Appropriate autobrake setting for desired stopping distance;
- Flap setting; and
- Bleed configuration.Footnote 33
1.18 Additional information
1.18.1 Approach speeds
According to WestJet's FOM, if the autothrottle is disconnected or is planned to be disconnected prior to landing, which was the case in this occurrence, the target approach speed is calculated as follows:
Add ½ the reported steady headwind component plus the gust increment above the steady wind to VREF. The minimum target speed is VREF + 5 knots and the maximum target speed should not exceed VREF + 15 knots.
[…]
NOTE: Do not apply wind additives for tailwinds.Footnote 34
The occurrence aircraft’s landing weight was 144 080 pounds and the calculated Vref with flaps at 30 was 147 knots. The winds reported to the flight crew throughout the descent and on final indicated a tailwind component for Runway 14 ranging from 9 to 15 knots. Because of this tailwind, the target approach speed according to the FOM, should have been Vref + 5 knots, or 152 knots.
In this occurrence, the flight crew had calculated the target approach speed using the winds of 030°M at 16 knots, gusting to 24 knots. Using Runway 05 as the landing runway, the flight crew calculated half of the steady wind (8 knots) and a gust increment of 8 knots, for a total wind additive of 16 knots. Since the maximum target approach speed is Vref + 15 knots, the flight crew used 162 knots as their target speed. This speed was carried over and used for Runway 14 and was consistently held until the touchdown.
1.18.2 Landing performance
Before departure, the flight crew received a flight planning package compiled by company dispatch. This package included all information pertinent to the flight, such as the operational flight plan—which provided alternate airport information—the weather, NOTAMs, and the TLR.
For planning purposes, the information provided to the flight crew for CYHZ indicated the alternate airport of Fredericton International Airport (CYFC), New Brunswick. The aircraft had adequate fuel on board at landing to divert to it.
1.18.2.1 Landing distance calculation
In order to determine the required landing distance, pilots have the option of using the ACARS landing distance calculator, TLR data, or the QRH actual landing distance table.
The QRH outlines the steps to follow to determine the appropriate braking action to be used for landing distance calculations. Flight crews use the runway condition equivalency table (Figure 4) to determine the braking action based on the RSC.
![Runway condition equivalency table (Source: WestJet Airlines Ltd., 737NG Flight Operations Manual – 737NG Quick Reference Handbook, Revision 6 [18 June 2019], Performance – General, p. PI-General.10.7, with TSB annotations)](/sites/default/files/eng/rapports-reports/aviation/2020/a20a0001/images/a20a0001-figure-04.jpg)
During periods of precipitation (i.e., active conditions), flight crew are to modify the braking action using the active conditions modification table (Figure 5).
![Active conditions modification table (Source: WestJet Airlines Ltd., 737NG Flight Operations Manual – 737NG Quick Reference Handbook, Revision 6 [18 June 2019], Performance – General, p. 10 PI-General.10.1, with TSB annotations)](/sites/default/files/eng/rapports-reports/aviation/2020/a20a0001/images/a20a0001-figure-05.jpg)
In this occurrence, the RSC of 100% trace of wet snow correlated to a braking action of “good.” However, because it was snowing, the flight crew modified the braking action to “good to medium” in accordance with the active conditions modification table. This data was then used to determine the landing distance and the associated autobrake setting.
When calculating the landing distance, a 15% safety margin is factored in all of WestJet’s charts, and pilots use these factored numbers for normal landing distance calculations.
Each of the 3 ways of calculating landing distances (ACARS landing distance calculator, TLR data, and QRH landing distance table) is discussed separately in the following sections. The data are based on a landing weight of 144 000 pounds, autobrake 3, good to medium braking action, flap setting of 30, and a normal approach speed.
1.18.2.1.1 Aircraft communications addressing and reporting system landing distance calculator
To obtain landing distances via ACARS, flight crew must enter the following data into the ACARS via the FMC: the airport identifier, landing runway, reported braking action, magnetic surface wind, outside air temperature, barometric pressure, whether the engine anti-ice is ON or OFF, flap setting of 30 or 40, and the actual aircraft weight. The data is then sent to a server that calculates the landing distances.
Once the server has completed the landing distance calculations, the flight crew receives a text message with the landing distances for the airport conditions that were entered. The crew can receive data for up to 3 runways per airport per ACARS request.
In this occurrence, the flight crew requested the landing distance calculation for Runway 05 using ACARS. With autobrake 3, the required distance was calculated to be 7234 feet, which was within the distance available of 10 500 feet. The flight crew did not enter the data for Runway 14.
1.18.2.1.2 Takeoff and landing report data
WestJet’s COM provides the following information about landing reports:
The Landing Runway Analysis Report (Landing Report) is prepared for each flight based on the environmental conditions, runway conditions and aircraft configuration anticipated by the dispatcher at the time of landing at the destination airport. The Landing Report provides landing data for planned conditions as well as a range of data surrounding planned conditions. […]
The Landing Report is not runway specific; therefore:
- Tailwind corrections must be added to the required distance using the wind corrections at the bottom of each Landing Distance Section;
- Crosswind limits must be checked for each runway;
- Landing distance requirements must be checked for each runway; and
- No alert messages are provided for runway exceedances.Footnote 35
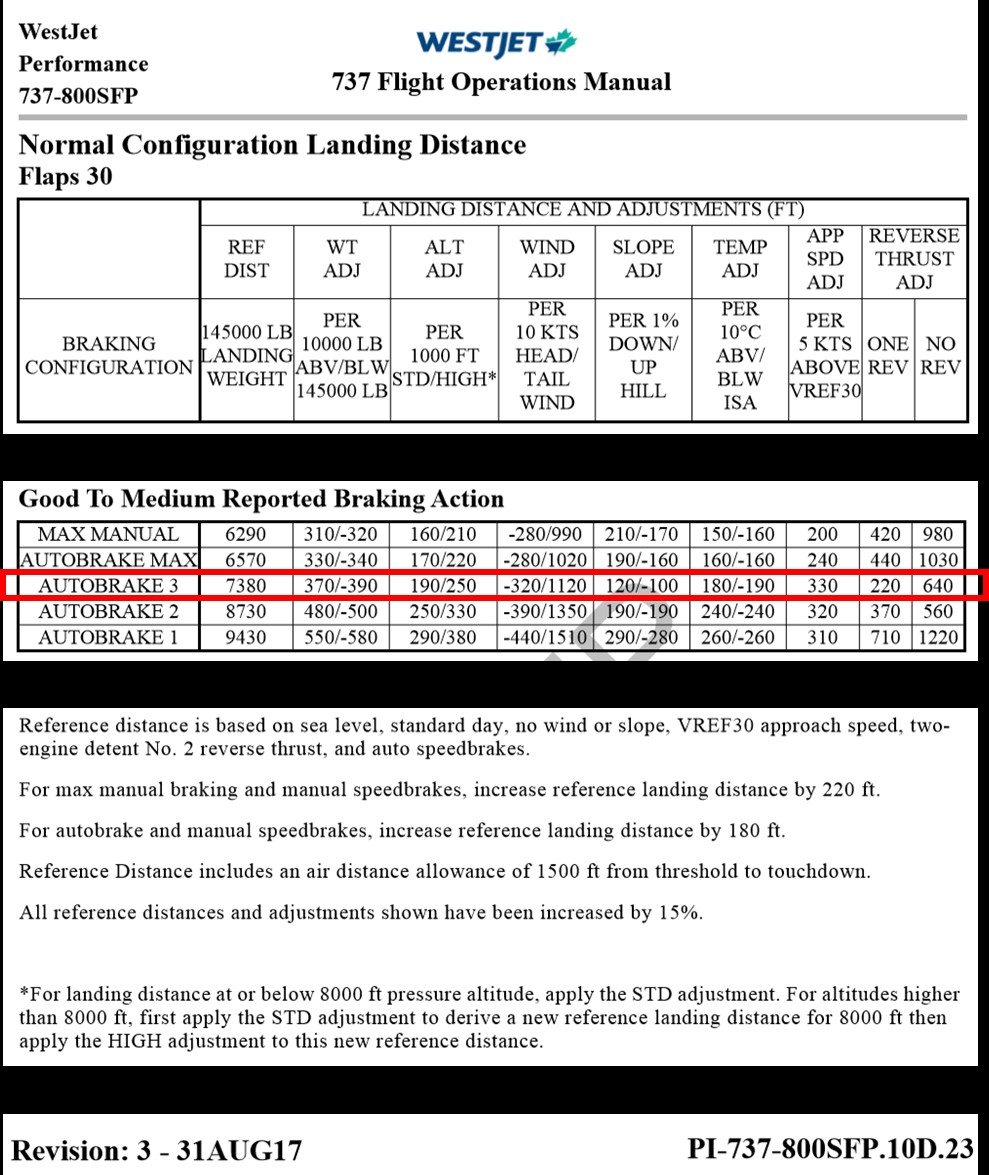
The TLR, which company dispatch provides to the flight crew, includes the in-flight factored landing distances, based on aircraft weight, flap configurations of 30 and 40, autobrake setting, and included credit for normal reverse thrust.
The TLR data provided to the flight crew in this occurrence for autobrake 3 and flap 30 can be found in Appendix B.
1.18.2.1.3 Quick Reference Handbook landing distance table
The QRH actual landing distance table is normally referenced when either ACARS or TLR data is unavailable, or if abnormal conditions exist. According to the QRH,
The reference landing distance is a reference distance from 50 feet above the threshold to touchdown 1500 [feet] from the approach end of the runway to stop based on a reference landing weight and normal approach speed for the selected landing flap at sea level, zero wind, zero slope, ground spoilers (auto or manual) deployed immediately after touchdown, use of engine reverse thrust and a 15% safety margin. Subsequent columns provide adjustments for off-reference landing weight, altitude, wind, slope, temperature and speed.Footnote 36
The landing distance table provided in the QRH provides generalized calculations that summarize all conditions into one paper chart for quick reference (Appendix C). As a result, the values are more conservative compared to the data derived from the TLR and ACARS.
1.18.2.1.4 Boeing calculations based on actual aircraft speed
As part of the investigation, Boeing was asked to calculate the distance required using the actual speed of the aircraft over the threshold (Vref + 15 knots), based on the aircraft configuration during landing. These calculations included a 15% safety factor and assumed good to medium braking action, autobrake 3, flap setting of 30, and all thrust reversers operating.
The calculated landing distances for the various methods of calculation can be found in Table 4.
| Wind | Event | Tailwind component | Landing distance required based on appropriate target approach speed (Vref + 5 knots) (feet) | Landing distance required based on actual approach speed (Vref + 15 knots) (feet) | ||
|---|---|---|---|---|---|---|
| ACARS | TLR | QRH | As calculated by Boeing | |||
| 030°M at 16 knots gusting to 24 knots | Cruise | 9 knots | 7533 | 7583 | 8188 | 9213 |
| 020°M at 17 knots gusting to 27 knots | Crew request the ILS Runway 14 | 15 knots* | “Maximum tailwind exceeded” | 8169 | 8860 | 9810 |
| 010°M at 19 knots | Final wind check | 13 knots* | “Maximum tailwind exceeded” | 7975 | 8636 | 9614 |
* The tailwind component exceeds the landing tailwind limitation of the aircraft and, therefore, although the calculated distances are shown, the calculated distances are outside the performance data envelope.
1.18.3 Aircraft braking coefficient
Aircraft braking coefficient (ABC) is defined as the ratio of the deceleration force from the wheel brakes relative to the normal force acting on an airplane. The ABC is an all-inclusive term that incorporates effects due to the runway surface, contaminants, and airplane braking systems (for example, antiskid efficiency, brake wear, tire condition, etc.). Therefore, ABC is not equivalent to the tire-to-ground friction coefficient that would be measured by an airport ground vehicle conducting RSCs. If the airplane braking is friction-limited (i.e., the antiskid system is limiting the commanded brake pressures to prevent tire slippage), the ABC can be used to approximate the runway condition in terms of pilot reported braking action. Table 5 shows examples of runway conditions and their corresponding ABC.
| Pilot reported braking action | Aircraft braking coefficient | Description |
|---|---|---|
| Dry | Approximately 0.40 | Dry runway |
| Good | 0.20 | Wet runway |
| Medium | 0.10 | Compact snow |
| Poor | 0.05 and less | Generic ice, wet ice |
Following the occurrence, the manufacturer calculated the ABC during the time that the antiskid system was active. The average ABC was 0.09, which, according to Table 5, corresponds to a braking action of “medium to poor,” and is characteristic of a contaminated runway (i.e., snow, ice, etc.).
With reference to the runway condition equivalency table (Figure 4), the equivalency of “medium to poor” braking is described as an RSC of dry or wet snow greater than trace, at or above -3 °C; or water/slush of 1/8” or greater.
When the TSB investigators arrived on scene a few hours after the occurrence, the runway conditions had changed. The investigation was unable to determine the actual conditions at the time of the overrun. However, the difference in braking action between a trace, and greater than a trace, of wet snow varies from “good” braking to “medium to poor” braking. This shows a small change in runway condition can have a great variance in braking.
1.18.4 Human factors
1.18.4.1 Mental model
Humans make decisions in part by building a mental model of the world. Because of the limitations of the senses, this mental model is never completely accurate: it is a representation. Often, the mental representation is accurate enough, and reduces cognitive demands so that attention is freed up and directed elsewhere. When inaccurate information creeps in or gaps in understanding appear, humans make sense of the incomplete, ambiguous cues, and often the mental representation is sufficient. Sometimes, however, this representation can be incorrect, and actions based on it can also be incorrect for the true situation.
1.18.4.2 Cognitive aspects of safe and efficient performance
At any given time, a person’s normal activity reflects a subconscious attempt to balance use of efficient ways of working with the more demanding cognitive processing of information.
It is necessary to be efficient because resources [especially time] always are limited.[…] It is likewise necessary to be thorough both to make sure that we do things in the right way [i.e. procedures followed, checklists done, monitoring and cross-checking done, weather and wind checks made], so that we can achieve what we intend, and to avoid adverse consequences.Footnote 37
Balancing demands for efficiency and thoroughness is a characteristic of human performance, and occurs because people “are flexible, intelligent beings”Footnote 38 capable of making assessments and taking action, evaluating and adjusting. There are many standard operating procedures in airline operations designed to require a flight crew to be thorough to counteract the time and resource pressures of the operation; for example, checklists are designed to slow human performance (in some situations) and add double-checks (i.e. challenge-response items) for safety-critical steps.
1.18.4.3 Situational awareness
Situational awareness has been defined as “the perception of the elements in the environment within a volume of time and space, the comprehension of their meaning and the projection of their status in the near future.”Footnote 39 This definition cites 3 essential levels that are critical for effective performance in dynamic environments: performance that produces a desired result relies on an individual's ability to take in information (perception) and to understand both its meaning (comprehension) and its implications for the future of the operation (projection). Situational awareness is a construct that describes how humans perceive information, understand it, make predictions about it, creating an awareness of the present situation about themselves.
1.18.4.4 Plan continuation
Plan continuation is the tendency of individuals to continue their original plan of action even when changing circumstances require a new plan.Footnote 40,Footnote 41 It means sticking with the original plan while a situation has actually changed and calls for a different plan.Footnote 42 Once a plan is made and committed to, it becomes more difficult for stimuli or conditions in the environment to be recognized as indicating a need for change than if a plan had not been made. For pilots to recognize and act on a reason to change the plan in a timely manner (e.g., identify the need to divert an approach), conditions need to be perceived as sufficiently salient to require immediate action.
Most important in the continuing of plans (or in the abandoning of them for an alternative) are the contextual factors that surround people at the time. The order in which cues about the developing situation arrive, and their relative influence, are 2 key aspects. Situational stimuli and conditions often deteriorate gradually and ambiguously, not quickly and obviously. “In such a gradual deterioration, there are almost always strong initial cues that suggest that the situation is under control and can be continued without increased risk.”Footnote 43 This helps lock people into continuing. Often the consequences of abandoning a plan are high (e.g., diverting, missed approach) and a crew requires strong evidence to change.
Highly connected to this gradual change of situational conditions is an increasing workload that is often not recognized at the time. A narrowing of attention can occur when workload increases and can contribute to the tendency of plan continuation in that changes in the situation and stimuli are not detected as a person focuses attention on the primary task. This is a natural human coping strategy to manage increasing workload.Footnote 44
1.18.4.5 Crew resource management and threat and error management
Modern CRM is augmented by applying TEM concepts with the goal of managing operationally relevant threats and errors thereby reducing the incidence of undesired aircraft states.Footnote 45 Threats and errors are normal in daily flight operations and must be managed. “Crew countermeasures are [...] the tools that pilots develop to handle these daily threats and errors.”Footnote 46
1.18.4.6 Skill-based performance in aircraft maintenance
There are 3 general ways to classify human performance from an information processing perspective: skill-, rule-, and knowledge-based performance.Footnote 47 Skill-based performance is observed in familiar situations and tasks that require very little attention to perform. Typically these tasks are relatively routine, predictable, and highly practised. Typing on a keyboard, and transcribing information from a reference document to a written instruction could fall into such a level of performance. This level of performance is not chosen; rather it becomes or is automatic.
The benefit of skill-based performance is that it is very fast and requires very little attention, freeing information processing resources for other things. However, these benefits make it susceptible to slips and lapses of attention, where the automatic routine is interrupted or disrupted during its execution, and the interruption or disruption is not detected. Mitigations for skill-based performance slips and lapses include checklists, drop-down or fill-in forms, reviews and inspections, well-designed procedures and memory aids.Footnote 48
1.18.5 Runway overrun studies and references
Runway overruns are an international concern and have been studied by different agencies, organizations and manufacturers to determine the causes that lead to aircraft being unable to stop on the runway and the factors that can mitigate the risk of this occurring.
To provide pilots and operators with a way "to identify, understand, and mitigate risks associated with runway overruns during the landing phase of flight,"Footnote 49 the Federal Aviation Administration (FAA) issued AC 91-79A in 2014 (amended in 2018). The AC states that:
A study of FAA and NTSB [U.S. National Transportation Safety Board] data indicates that the following hazards increase the risk of a runway overrun:
- Unstabilized approach;
- High airport elevation or high-density altitude (DA), resulting in increased groundspeed;
- Effect of excess airspeed over the runway threshold;
- Airplane landing weight;
- Landing beyond the touchdown point;
- Downhill runway slope;
- Excessive height over the runway threshold;
- Delayed use of deceleration devices;
- Landing with a tailwind; and
- A wet or contaminated runway.Footnote 50
According to the AC,
An excessive approach speed may result in an excessive speed over the runway’s threshold, which may result in landing beyond the intended touchdown point as well as a higher speed from which the pilot must bring the airplane to a stop.Footnote 51
The AC also states,
The effect of a tailwind on landing distance is significant and is a factor in determining the landing distance required. Given the airplane will land at a particular airspeed, independent of the wind, the principal effect of a tailwind on operational landing distance is the change in the ground speed at which the airplane touches down.Footnote 52
These will effectively lead to a longer landing distance.
Other studies, such as an analysis of a 14-year period on runway overrun data by the Flight Safety Foundation, indicate similar results.Footnote 53 When Boeing published an article in its AERO magazine about reducing runway landing overruns, it recognized that a frequent contributor to these events is a lack of recognition of the actual conditions:
Runway overrun event data suggests that a number of runway overruns can be avoided if the flight crew has a more thorough understanding of the interrelationship between the landing environment and the potential risks existing that day (e.g. weather, winds, runway conditions, minimum equipment list items, airplane weight).Footnote 54
1.18.6 Runway overrun awareness and alerting systems
The availability of newer technological defences has increased. Runway overrun awareness and alerting systems (ROAAS) developed for aircraft can assist in reducing the number of runway excursions, particularly during landing. The technology sends visual and aural alerts to the pilots pre-touchdown if conditions indicate that landing cannot be completed within the available landing distance for the intended runway. The technology can even monitor post-touchdown conditions if braking performance is not as anticipated.
In 2011, the NTSB recommended that the FAA
actively pursue with aircraft and avionics manufacturers the development of technology to reduce or prevent runway excursions and, once it becomes available, require that the technology be installed.Footnote 55
In its 2018 response to the recommendation, the FAA highlighted that ROAAS technology was now available and actively being installed by some major airplane manufacturers (Airbus, Boeing, Embraer, and Gulfstream). The FAA also noted that Honeywell had developed a system that can be installed on in-service airplanes. With this information, the NTSB agreed that many operators were adopting the software voluntarily, which is an alternative that satisfies the intent of the recommendation. In September 2018, the NTSB closed the recommendation as acceptable alternate action taken.
In August 2020, the European Union Aviation Safety Agency (EASA) amended regulations to state:
Operators of large aeroplanes used in commercial air transport shall ensure that every aeroplane for which the first individual certificate of airworthiness was issued on or after 1 January 2025, is equipped with a runway overrun awareness and alerting system.Footnote 56
ROAAS have not been widely adopted by Canadian operators; however, some operators have informed the TSB that they are planning to install such systems over the next few years. WestJet does not currently have ROAAS on its aircraft, and does not have any plans for their installation. ROAAS are not required by regulations.
1.18.7 Runway end safety area
According to TC’s AC 300-007, the purpose of a RESA is
to have an area free of objects other than frangible visual aids required to be there by function, so as to reduce the severity of damage to an aircraft overrunning or undershooting the runway, and to facilitate the movement of rescue and fire fighting vehicles.Footnote 57
In 2015, TC published a new edition of its Aerodrome Standards and Recommended Practices (TP312),Footnote 58 in which a 150 m (493 feet) RESA became the standard. However, this standard is only required on new or substantially modified runways built after the standard came into effect.
In March 2020, TC proposed regulationsFootnote 59 that would, among other things:
- Require a 150 m RESA at airports with over 325 000 commercial passengers annually;
- Require the use of an arresting system on runways where the 150 m RESA cannot be implemented; and
- Be limited to runways serving commercial passenger services.
According to TC, these regulations, once implemented, will increase runway overrun protection to passengers from 75% of passenger traffic in 2017 to 95% by 2038. However, these regulations focus only on the risk to a majority of, but not all, passengers and do not consider non-passenger air traffic or the terrain at the end of all runways. Also, the TSB believes that the proposed regulations may not fully meet the ICAO standard, which requires a 150 m RESA for all runways 1200 m in length and longer, and provisions for other types of runways.Footnote 60
All 4 runways at CYHZ have a RESA of 150 m.
Finding: Other
In this occurrence, the aircraft stopped within the RESA.
1.18.7.1 TSB recommendation
Following the TSB’s investigation into a 2005 runway overrun accidentFootnote 61 of an Airbus 340-313 at Toronto/Lester B. Pearson International Airport, the Board recommended that:
the Department of Transport require all Code 4 runways to have a 300 m runway end safety area (RESA) or a means of stopping aircraft that provides an equivalent level of safety.
TSB Recommendation A07-06
Since then, TC has provided several responses, all of which have been assessed by the TSB.
In February 2021, in an update to its most recent response, TC stated that the amendments to the CARs noted above were published in the Canada Gazette, Part I on 07 March 2020. TC is aiming to publish these amendments in the Canada Gazette, Part II in May 2021.
In March 2021, in its reassessment of TC’s latest response, the TSB noted that TC had proposed regulations to address RESAs. The proposed regulatory changes, as currently written, will reduce the risks associated with an overrun; however, not to the level that would be afforded by the ICAO-recommended 300 m RESA. At a minimum, the Board believes that the proposed regulations must meet the ICAO standard.
Runway overruns continue to occur, and the lack of timely action will continue to expose commercial air travellers in Canada to unnecessary risks until these regulatory amendments are implemented.
Therefore, the Board reassessed TC’s latest response to Recommendation A07-06 as Satisfactory in Part.Footnote 62
1.18.8 TSB Watchlist
The TSB Watchlist identifies the key safety issues that need to be addressed to make Canada’s transportation system even safer.
Runway overruns have been on the TSB Watchlist since 2010. As this occurrence demonstrates, when a runway overrun occurs during landing, it is important that the aircraft have an adequate safety area beyond the end of the runway to reduce adverse consequences.
Despite the millions of successful movements on Canadian runways each year, runway overrun accidents sometimes occur during landings or rejected takeoffs. Between 2005 and 2019, there have been on average 9.7 runway overrun occurrences per year at Canadian airports, of which 7.5 occur during landing. Additionally, in that same time period, the TSB investigated 19 such occurrences and issued 4 recommendations to Canadian authorities. At the time of writing this report, 3 of the recommendations are active Footnote 63 and 1 is closed. Footnote 64
ACTIONS REQUIRED
|
1.19 Useful or effective investigation techniques
Not applicable.
2.0 Analysis
There was no indication of mechanical fault or system failure during the occurrence landing. The analysis will focus on the flight crew’s decision-making process when changing runways and assessing landing distance, as well as the aircraft performance on the contaminated runway with the tailwind conditions that were present. In addition, the analysis will discuss risks associated with overwriting cockpit voice recorder (CVR) data. Finally, the analysis will discuss aids available to assist pilots in runway situational awareness.
2.1 Runway change and assessment of landing distance
While in cruise, the flight crew prepared for their approach by reviewing the weather information available. At that time, the designated runway in use was Runway 05. The flight crew determined that the length of Runway 05 was sufficient given the calculated landing distance required. Based on the winds, the flight crew calculated the target approach speed of 162 knots (landing reference speed [Vref] + 15 knots).
As the aircraft approached the airport, the flight crew received new weather information, indicating a lower ceiling. Because this ceiling was below the published minima for the approach to Runway 05, the flight crew requested the Runway 14 instrument landing system (ILS) approach. The investigation determined that the winds provided by the area control centre controller at that time (020° magnetic [M] at 17 knots, gusting to 27 knots) resulted in a 15 knot tailwind component for Runway 14.
Finding as to causes and contributing factors
While preparing for the runway change, the flight crew mentally assessed that the wind for Runway 05 would become a crosswind for Runway 14. As a result, they did not recalculate the effects of the wind for the approach to Runway 14, but rather considered that the landing distance and the target approach speed calculated for Runway 05 were still appropriate.
This mental model was likely a natural response by the flight crew to reduce cognitive effort during a time of high workload. Without the tailwind component being recognized when Runway 14 was selected, the wind information was not salient to the flight crew during the remainder of the approach and landing, contributing to the flight crew’s continued approach to Runway 14.
Using the winds that were reported during cruise (030°M at 16 knots, gusting to 24 knots), the landing distance required for Runway 05, calculated via the aircraft communications addressing and reporting system (ACARS), was within the 10 500 feet available. If the crew had calculated the distance required for Runway 14 using these same winds, they would have determined that the distance available was also sufficient (i.e., less than 7700 feet). However, the surface winds changed during the approach and landing.
Finding as to causes and contributing factors
The reported winds on the ground had backed and increased slightly as the flight progressed. This resulted in a tailwind component that exceeded the operator’s limitation of 10 knots, a lower required approach speed of Vref + 5 knots, and a landing distance that exceeded the runway length available. None of this was recognized by the flight crew and, as a result, they continued the approach to Runway 14.
2.2 Approach and landing
Approach and landing is a critical phase of flight. Runway changes, low visibility conditions, wet runway surfaces, and tailwinds are routine conditions that increase complexity during approach and landing. Threat and error management, as part of crew resource management practices, supports crews in managing these routine aspects of airline operations.
From the time that the flight crew requested the approach until touchdown on Runway 14, they were busy with reprogramming the approach and conducting the approach. The flight crew requested information on any braking action reports for Runway 14. They also recognized the low visibility conditions, and, although it was not required, they completed the low-visibility approach checklist to manage the threat. Furthermore, they anticipated and experienced turbulence at lower altitudes, which further increased the workload for the captain, who was the pilot flying (PF).
Situational awareness is based on perceiving, understanding and predicting information to create an awareness of the environment and unfolding events. Perception can be affected by a narrowing or focusing of attention that can occur when workload is high, and can result in some information not being processed or being missed. This can also contribute to continuing a plan when the plan is no longer viable (plan continuation). The flight crew were receiving and processing a lot of information and had many actions to perform quickly in the 14 minutes between the runway change and touchdown. The flight crew, focused on the conditions of the runway and the landing, did not detect the changes in the wind and the tailwind component. Without a salient cue to help them identify this, the flight crew continued the approach.
The PF flew a stable approach. When the tower controller provided the flight crew with a final wind check of 010°M at 19 knots, the flight crew still did not recognize this as significant, concentrating on the crosswind, turbulence, low visibility and runway surface condition. The PF continued using the briefed approach speed of Vref + 15 knots calculated for the original runway, and maintained it until the flare. The extra speed was in excess of the company’s procedure of using Vref + 5 knots for tailwinds.
Finding as to causes and contributing factors
The unchanged target approach speed combined with the tailwind resulted in the aircraft crossing the threshold 10 knots faster than recommended and touching down at a faster groundspeed, thus requiring a longer stopping distance.
2.3 Touchdown and runway overrun
The aircraft touched down at 164 knots and at a groundspeed of 173 knots. It landed within the touchdown zone, and the deceleration devices, such as the speedbrakes and thrust reversers, deployed as designed. The PF, recognizing the faster speed on the rollout, applied manual braking. By using manual braking, the autobrake 3 selection disengaged.
The antiskid system activated immediately upon use of manual braking and likely remained active for the remainder of the rollout. Regardless of whether autobrake 3 selection had remained on or the PF had maintained maximum braking and maximum reverse throughout, the aircraft’s antiskid system was likely active, already providing the maximum deceleration available for the runway conditions.
The runway surface condition was reported as trace of wet snow, which equates to a “good” braking action, according to the runway condition equivalency table. However, the deceleration obtained during the rollout represents a braking action more akin to “medium to poor.” In terms of wet snow, the difference between good braking and medium to poor braking is predicated on whether there is a trace or greater than a trace.
The investigation could not determine the actual condition of the runway. The braking action expected (good to medium) based on the reported runway surface condition was not equivalent to the braking action encountered (medium to poor). The degraded runway condition decreased the braking action. Even if the braking action had been good to medium, the investigation calculated that the required landing distance would have exceeded the distance available.
Finding as to causes and contributing factors
The wet snow contamination on the runway resulted in a reduction in braking effectiveness, contributing to an increase in landing distance.
Finding as to causes and contributing factors
The increased landing distance required, given the fast approach, the tailwind component, and the contaminated runway, exceeded the remaining runway available and resulted in an overrun.
No injuries or damage occurred when the aircraft stopped within the runway end safety area.
2.4 Preservation of the cockpit voice recorder
In this occurrence, upon hearing communications between the flight crew and dispatch, the maintenance controller on duty searched and located the circuit breaker numbers for the CVR and flight data recorder using the Fault Isolation Manual.
Skill-based tasks, such as typing, are susceptible to slips and lapses of attention. If there is no way of mitigating these, errors can be introduced. In this case, the maintenance controller typed the circuit breaker numbers in the ACARS message. However, the ACARS message was typed incorrectly, likely because of a slip of attention, stating circuit breaker C7 and repeating C8 when it needed to state D6 and D7. As a result of the flight crew following the ACARS instructions, the appropriate CVR circuit breaker was not pulled. Consequently, the CVR continued recording while the aircraft was on the ground, and the recording of the event was overwritten.
Finding as to risk
If the CVR is not disabled following an occurrence, there is a risk that information valuable to the investigation may be lost.
2.5 Aids to assist pilots in runway situational awareness
New technologies can assist pilots during critical phases of flight and help them to prevent runway overruns. Several manufacturers have developed runway overrun awareness and alerting systems for aircraft. Manufacturers like Boeing have started installing these systems into newer aircraft; however, at the time of writing this report, there was no regulation mandating their installment.
Other aids are also available to assist pilots during a landing. These can help pilots maintain situational awareness, i.e., where they are on the runway and how much length remains, so that they can react in a timely manner. One aid that assists pilots is the changing centreline lighting, which lets them know when they are approaching the runway end by changing the colour of the lights. As the aircraft approaches the end of the runway, the lights change from white to red, providing pilots an indication that the runway end is near. These indications are normally found on runways that are equipped with category II approaches, such as Runway 23 at Halifax/Stanfield International Airport.
Other airports throughout the world, and some Canadian facilities that service the military, have adopted distance remaining signage. These signs assist pilots by showing the distance remaining on the runway in increments of 1000 feet.
In this occurrence, the PF briefly reduced the reverse thrust and the braking action at 60 knots as per the standard operating procedures. However, even maintaining full reverse thrust and braking would not have prevented the aircraft from departing the runway, given that the antiskid system was engaged.
In other circumstances, the use of maximum deceleration devices may be key to avoiding runway overruns. Visual cues to know the length of runway remaining can aid the pilots in their decision to use these devices in a timely manner.
Finding as to risk
Without additional cues (e.g., enhanced technology or visual aids) to help flight crews determine runway suitability before landing and aircraft position once on a runway, there is a continued risk that flight crew actions based on weak or non-salient cues will result in runway overruns.
3.0 Findings
3.1 Findings as to causes and contributing factors
These are conditions, acts or safety deficiencies that were found to have caused or contributed to this occurrence.
- While preparing for the runway change, the flight crew mentally assessed that the wind for Runway 05 would become a crosswind for Runway 14. As a result, they did not recalculate the effects of the wind for the approach to Runway 14, but rather considered that the landing distance and the target approach speed calculated for Runway 05 were still appropriate.
- The reported winds on the ground had backed and increased slightly as the flight progressed. This resulted in a tailwind component that exceeded the operator’s limitation of 10 knots, a lower required approach speed of Vref + 5 knots, and a landing distance that exceeded the runway length available. None of this was recognized by the flight crew and, as a result, they continued the approach to Runway 14.
- The unchanged target approach speed combined with the tailwind resulted in the aircraft crossing the threshold 10 knots faster than recommended and touching down at a faster groundspeed, thus requiring a longer stopping distance.
- The wet snow contamination on the runway resulted in a reduction in braking effectiveness, contributing to an increase in landing distance.
- The increase in the landing distance due to the fast approach, combined with the tailwind component and contaminated runway, was in excess of the remaining runway available and resulted in the overrun.
3.2 Findings as to risk
These are conditions, unsafe acts or safety deficiencies that were found not to be a factor in this occurrence but could have adverse consequences in future occurrences.
- If the cockpit voice recorder is not disabled following an occurrence, there is a risk that information valuable to the investigation may be lost.
- Without additional cues (e.g., enhanced technology or visual aids) to help flight crews determine runway suitability before landing and aircraft position once on a runway, there is a continued risk that flight crew actions based on weak or non-salient cues will result in runway overruns.
3.3 Other findings
These items could enhance safety, resolve an issue of controversy, or provide a data point for future safety studies.
- In this occurrence, the aircraft stopped within the runway end safety area.
4.0 Safety action
4.1 Safety action taken
4.1.1 WestJet
Following the occurrence, WestJet took the following actions:
- A revised emergency response checklist was created to include the requirement to pull the cockpit voice recorder/flight data recorder circuit breakers after an incident.
- A detailed safety review of findings and root causes upon completion of the internal investigation was completed with both flight crew members by the Chief Pilot, B737.
- A flight data monitoring (FDM) trigger was created to monitor landings over the maximum tailwind. This item will be monitored as part of the existing FDM quarterly event review.
- A Flight Safety Flash was sent out to the entire pilot group bringing awareness to the event and:
- highlighting the importance of considering continually changing conditions that may impact runway surface or anticipated wind conditions;
- highlighting the importance of utilizing actual runway of intended landing for performance calculations and the requirement to use 1 of the 3 required methods to calculate numbers: the aircraft communications addressing and reporting system Landing Distance Calculator, the Takeoff and Landing Report, and the Quick Reference Handbook actual landing distance table; and
- clarifying the 15% safety margin.
This report concludes the Transportation Safety Board of Canada’s investigation into this occurrence. The Board authorized the release of this report on . It was officially released on .
Appendices
Appendix A – Halifax/Stanfield International Airport ILS RWY 14 approach chart
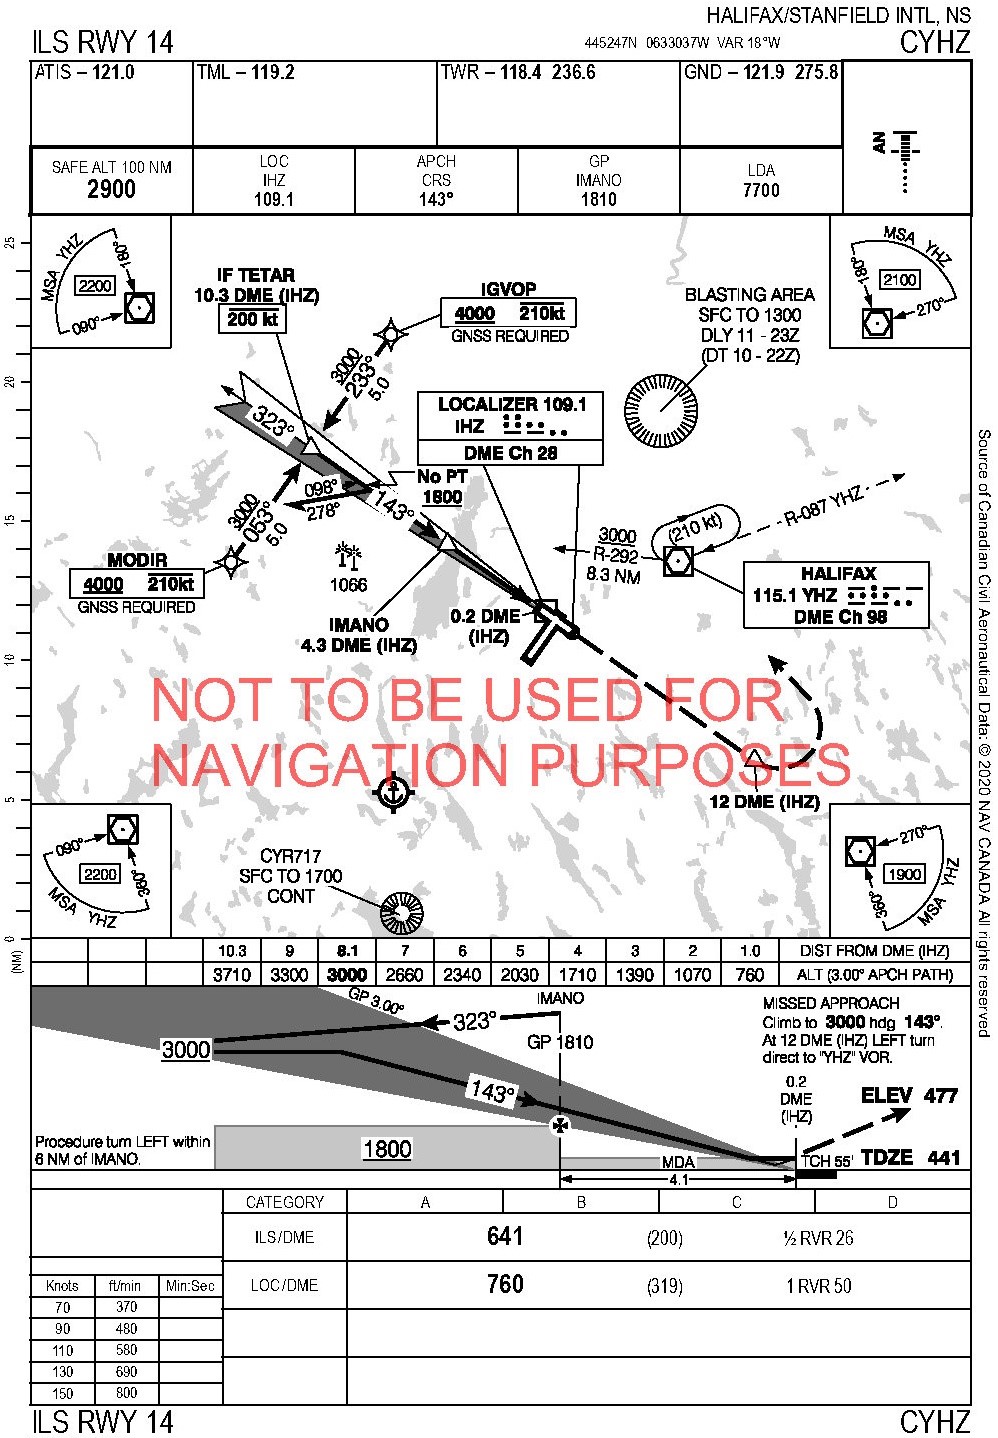
Source: NAV CANADA, Canada Air Pilot
Appendix B – Excerpt from the occurrence flight takeoff and landing report
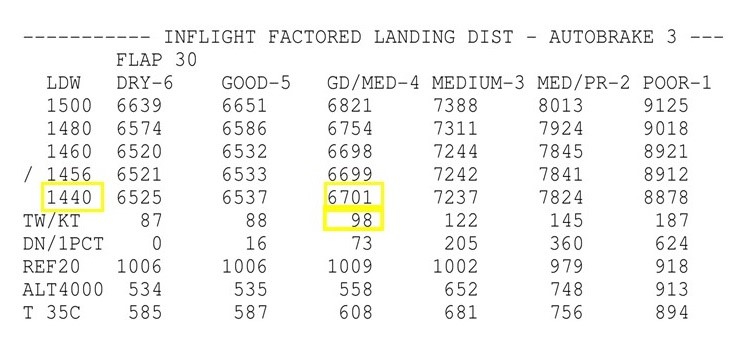
Source: WestJet Airlines Ltd., with TSB annotations
Appendix C – Excerpts from Quick Reference Handbook Landing Distance
Source: WestJet Airlines Ltd., 737NG Flight Operations Manual – 737NG Quick Reference Handbook, Revision 6 (18 June 2019), Performance – Normal Configuration Landing Distance, p. PI-737-800SFP.10D.23, with TSB annotations.