Associated links (A98H0003)
-
Table of contents
- Recovery procedures
- Management and interpretation of information
- Speech micro-coding analysis
- Aircraft engine analysis
- Auger electron spectroscopy
- Simulator trials
- Temperature reference coupons
- Soot and colour reference standards
- Map lights
- Airflow flight tests
- Computer fire modelling
- In-flight fire time study
Techniques, tests, and research
Recovery procedures
To control and document the disposition of recovered aircraft debris, an aircraft exhibit control team was established in collaboration with the RCMP. The exhibit control team was assigned the following tasks:
- Maintain continuity (chain of evidence) of all recovered aircraft debris.
- Sort, organize, and store all recovered aircraft debris.
- Identify specific items of higher importance to the investigation.
- Maintain the exhibit records.
- Create a database of detailed information on all stored exhibits.
Recovered aircraft debris was transported to shore by military, CCG, and civilian sea vessels. All recovered materials were taken to 12 Wing Shearwater. Some materials were also transported by helicopter. High-priority items, such as key aircraft components, currency, and valuables were recovered, secured, and hand-delivered to Shearwater by TSB or RCMP personnel. Paper items retrieved from the ocean, such as aircraft manuals, were freeze-dried to prevent further deterioration.
Upon arrival at Shearwater, the debris was washed in fresh water and processed through a decontamination line, located alongside the unloading dock. Personal effects and aircraft wreckage were separated, placed into large cardboard containers, and transported to "A" Hangar at 12 Wing Shearwater. Human remains were transported to the temporary morgue, located in "B" Hangar at 12 Wing Shearwater.
Aircraft debris arriving at "A" Hangar was sorted and examined by a team of TSB, Boeing, Swissair, and RCMP personnel. Each item was examined to determine its approximate location within the aircraft (nose, wing, centre, tail) and to assess the significance of the item to the investigation. Particular emphasis was placed on debris exhibiting heat damage, burn residue, or unusual markings. Each item of debris was designated as either initially non-significant or significant to the investigation. Assistance was provided by personnel from the NTSB, the Swiss AAIB, the ALPA, Pratt & Whitney, and various other companies and organizations.
It is estimated that more than 2 million pieces of wreckage were recovered. To organize the storage of this debris, a grid system was laid out in "A" Hangar to represent various sections of the aircraft, as follows:
| Grid | Aircraft Section |
|---|---|
| 1 | Left Wing Upper |
| 2 | Left Wing Lower |
| 3 | Tail |
| 4 | Aft |
| 5 | Miscellaneous |
| 5B | Fire |
| 6 | Centre |
| 7 | Forward |
| 8 | Nose |
| 9 | Right Wing Lower |
| 10 | Right Wing Upper |
| 11 | Engines |
| 12 | Seats |
| 12A | Wiring |
Non-significant items identified as belonging to a specific section of the aircraft were placed, when possible, into large storage boxes fabricated from tri-wall cardboard. Several storage boxes, each corresponding to a grid section, were set up inside "A" Hangar. Non-significant items were placed inside the storage box that corresponded to the item's original location (grid section) on the aircraft. For example, a piece of aircraft tail section would have been placed into a storage box labelled Grid 3—Tail. Once a long-term storage box was full, it was weighed and transported from "A" Hangar to "J" Hangar at 12 Wing Shearwater, a temporary hangar constructed specifically for long-term storage of aircraft parts. Each storage box was given an exhibit number and was labelled with a description of the contents, weight, and "J" Hangar location.
If a recovered item was too large to be placed inside a long-term storage box, it was weighed and placed outside in a secure compound next to "J" Hangar. The compound was a fenced-in storage area into which large pieces of recovered aircraft were placed and grouped in accordance with the grid system. For example, a large piece of recovered centre fuselage would be placed inside the compound in the area labelled Grid 6—Centre.
Significant items and parts used in the reconstruction mock-up were photographed and entered into the exhibit control system by an RCMP exhibit custodian. The exhibit custodian assigned a unique exhibit number to each item, completed an exhibit report for each item, and recorded the details of each exhibit in the master exhibit ledger. A textual summary description was also produced for each exhibit. Unique exhibit numbers and summary descriptions were also assigned to groups of related items and to each long-term storage box containing non-significant items.
The exhibit numbering system comprised an exhibit number followed by an individual item number. The exhibit number "1" designated the item as an aircraft exhibit. The exhibit number was followed by an item number assigned to that particular exhibit (item numbers started at 1 and increased sequentially). As an example, Exhibit 1-2385 indicates that the item is an aircraft exhibit with the unique item number of 2385. These numbers, which were used as the primary reference in all electronic databases and written reports, provided investigators with a means of tracking, locating, and retrieving specific wreckage items. Exhibit numbers were also used to link and relate different types of information to a specific piece, or pieces, of wreckage. For example, photographs, laboratory test results, notes, and textual descriptions could be electronically associated with one or more exhibits. This information could then be electronically filed, organized, queried, and retrieved.
The exhibit custodian completed an exhibit report data capture sheet for each new exhibit, including the following information:
- Exhibit number
- Item number
- Date and time
- Anatomy, aircraft, or property
- Description and measurements
- Serial number/part number
- Date item was found
- Location where item was found and by whom
- Storage location
- Name of exhibit custodian completing the report
Sections of the exhibit report that could not be completed were left blank. If a detailed description of the item was not available, a general description of the item was recorded (e.g., "piece of green metal, unidentified"). If an exhibit was moved from its original storage location to a new location, an Exhibit Movement form was completed to maintain an accurate record of the location and movement of each exhibit.
An exhibit tag was completed for each new exhibit and placed next to the exhibit on the examination table. The tag was labelled with the exhibit number and the item number (e.g., 1-4325). A member of the RCMP forensic identification team then photographed the exhibit for identification purposes, including the exhibit tag. The exhibit was photographed with both a 35 mm camera and a digital camera. Additional photographs were taken by TSB investigators as required.
Once the exhibit was photographed, the exhibit tag was attached to the item with either a permanent metal or plastic fastener. If it was not possible to attach the exhibit tag, the exhibit and the tag were placed inside a clear bag and sealed. The exhibit and item number were also written directly onto the exhibit with a red permanent marker.
The exhibit was then taken by a member of the exhibit team to the appropriate storage location inside "A" Hangar where it was kept until further analysis could be completed. Sensitive or high-priority exhibits were stored within a secure exhibit room, which was initially maintained by the RCMP inside "A" Hangar.
Long-term storage boxes used to sort non-significant aircraft debris were also identified as exhibits. Entering the storage boxes as exhibits allowed the exhibit control team to maintain continuity of all recovered aircraft items. For each box, an exhibit and item number was assigned, an exhibit report data sheet was completed, and an exhibit tag was attached. The following information was recorded on each side of each storage box:
- Exhibit and item number (in red)
- Grid number and description of the box contents (in black)
- Storage location within "J" Hangar (in green)
- Weight of the contents (in blue)
Exhibit photographs and exhibit report data sheets were entered into the RCMP Evidence and Reports III database. The Evidence and Reports III database enabled investigators to retrieve exhibit data and to generate summary reports. The following information was recorded in the master exhibit ledger as a backup to the electronic database:
- Exhibit and item number
- Exhibit description
- Exhibit storage location
As recovered aircraft debris was processed at 12 Wing Shearwater, the weight of the debris was recorded in a master file. Exhibit control personnel continually updated the recovered weight of the aircraft debris (in total weight and as a percentage of the aircraft structural weight) and provided this data to investigators. (STI) The weight of the recovered aircraft debris allowed investigators to monitor the progress of the recovery operation. Approximately 98% (by structural weight) of the aircraft was ultimately recovered. (STI)
Management and interpretation of information
Several primary databases were established early in the investigation to assist in the management and tracking of investigation material.
Evidence and reports III database
The RCMP Evidence and Reports III database served as a repository of textual and photographic information about wreckage exhibits, including significant pieces of aircraft debris and bulk containers filled with non-significant debris. The Evidence and Reports III database user interface enabled the production of summary reports on specific exhibits.
TSB control log database
Additional investigation data in various formats, including audio cassettes, compact and floppy disks, microfilm, engineering drawings, text documents, facsimiles, and manuals were recorded in the TSB Control Log database. Similar to the wreckage exhibit system, a unique master number was assigned to each data item, or group of related items, in the control log. A general investigation subject file number was also assigned, and a short summary description was prepared including information about the media type, the origin of the data, when the data were received, and by whom. The Control Log database allowed investigators to track and retrieve investigation data and to electronically search fields for key words and phrases contained in any field. This capability was subsequently augmented by importing much of the textual data into the SUPERText® case management system.
SUPERText® software
SUPERText® softwareFootnote 1 was used to scan records and their associated summary descriptions. Embedded OCR algorithms were applied to extract the textual content of each document image in order to support electronic searches within the body of each scanned document. Additional software functions were used to further categorize the scanned documents into specific subject areas and to create search indexes within the SUPERText® image database. SUPERText® search functions enabled users to retrieve documents using a variety of search criteria including "keyword" and "text string" searches, and to view or print high-quality images of these documents. SUPERText® search results could be used by investigators in different geographic locations over a computer network or via remote access connections to the network.
Photo database
A photo database was developed to archive the large volume of digital images that were not associated with a particular exhibit and that were not, therefore, contained within the Evidence and Reports III database. The database was indexed to allow flexible searches by subject matter, date, location, and various other parameters.
CSRTG database
For many years, the aviation authorities of North America (US FAA and TC Civil Aviation), Europe (JAA), and Japan (JCAB) have been conducting individual and cooperative research in transport category aeroplane cabin safety. The CSRTG database is a repository for the cabin safety research efforts of the FAA, the JAA, the JCAB, and TC. The CSRTG database currently contains information on over 2 400 accidents. While the database was initially intended to support analytical work aimed at improving occupant survivability, the scope has recently been expanded to include information on non-survivable accidents. All data have been derived from reliable sources, primarily from accident investigating authorities. Records are stored for transport category passenger aircraft (those with 19 or more passenger seats) and cargo aircraft certified under the FAA, Part 25 requirements or their equivalent. The database contains photographs and diagrams as well as textual and numerical data. The CSRTG database was used by investigators to identify and validate the circumstances of previously reported aircraft accidents involving fires on transport category aircraft.
Geographic information system
The TSB developed a GIS to manage, correlate, and interpret spatially referenced exhibits and investigation data.Footnote 2 These data were stored on various media and recorded in one or more of the investigation databases. The GIS enabled the processing and analysis of large amounts of diverse information related to a particular location on the aircraft or on the surface of the earth. Examples of such data include bathymetry, topography, satellite imagery, radar images, laser environmental airborne fluoro sensor plots, aircraft flight path data, witness data, and wreckage exhibit data. A three-dimensional digital terrain model of the ocean floor was created and used in the GIS. The GIS approach was also used to facilitate the three-dimensional CAD reconstruction of aircraft occupant and aircraft wreckage information and for the analysis of fire damage. The spatial reference used was related to the aircraft coordinate system for a Swissair-configured MD-11 aircraft model.
Investigation photographs were taken with 35 mm, colour-reflex cameras and supplemented by digital camera photography. Digital photographs were often taken at the same time as 35 mm colour photographs, particularly when wreckage was being processed through the exhibit system. Digital photography was used to provide immediate image results to investigators and to serve as a backup to the colour negative film in the event that the photographs did not develop as expected. The 35 mm film was subsequently developed and the negatives were scanned onto a five-pack format Kodak® photo CD-ROM. The original negatives were then placed into a secure storage facility. Exhibit numbers present in the photographs and digital imagery were used to identify and subsequently catalogue pictures on CDs using the exhibit system. CDs were loaded into a multiple CD player unit, which was connected to the GIS through a computer network. Digital images were then retrieved, electronically processed (to adjust variables such as brightness, contrast, sharpness, and enlargement factors), and printed or copied for distribution. Segments of video and audio tapes were also digitized and incorporated into the GIS.
In order to create 360-degree views of the aircraft interior, a series of static photographs were taken with a tripod-mounted 35 mm camera fitted with a 20 mm lens and rotated in 20-degree increments. The resulting images were stitched into a continuous, 360-degree panorama using PhotoVista® 1.0 software, part of the Reality Studio software suite by Live Picture, Inc.Footnote 3 When the panorama is displayed on a computer, the viewer is able to navigate horizontally or vertically around the image. In addition to offering a wide field of view, the image can be magnified by electronically zooming in on a feature. The enhanced view can be printed, saved, and forwarded as an electronic file. The original panorama can also be saved or forwarded.
The Reality Studio software was also used to define links (hotspots) between individual panoramas by creating points within the imagery that allowed the viewer to jump from one panorama to another. Linked panoramas enabled investigators to navigate between various scenes. For example, a series of panoramas were made of the interior of different Swissair MD-11 aircraft in various states of repair and maintenance. The panoramas enabled areas, such as the cockpit to be compared to a normal interior. The normal interior was subsequently removed in stages to show underlying features that are not normally visible, including paint schemes, fabric types and patterns, the location and orientation of decals and labels, and various construction details. This information was used to assist in identifying and reconstructing the wreckage.
To photograph inaccessible areas, a remote-control, auto-focus camera with an integrated flash unit was placed on a pole, which could be rotated. The camera assembly was then projected up (like a periscope) into tight spaces, such as ceiling attic areas, to take panorama images. Digital cameras were frequently used in difficult circumstances to obtain immediate results. The same viewpoint was often re-photographed with a film camera. The 35 mm negatives were subsequently scanned into an electronic format to create high-resolution images where fine detail was needed, and to enable investigators to view regions of the aircraft that were difficult to access or physically examine.
Additional panoramas were taken in the aircraft wreckage three-dimensional reconstruction mock-up. The locations of these panoramas corresponded to the positions of panoramas taken of in-service aircraft. Electronic viewers were programmed to display two panoramas simultaneously, which enabled direct comparisons to be made between an intact aircraft and the badly damaged aircraft reconstruction. Panoramas were also taken at witness locations, which were used to better interpret witness statements.
Two-dimensional models of specific objects were created using Object Modeler® 1.0 software, also part of the Reality Studio software suite. In contrast to a panorama where a camera is rotated about a single point to document a scene, an object model was made by fixing the camera in position and rotating the object about a single point. Pictures were taken of the object in 10-degree increments as it was rotated through 360 degrees. This process was often repeated at different elevations (high and low vantage points) with respect to the object. In a process similar to the creation of a panorama, stitching software was then used to create a 360-degree view of the original object, which the viewer could rotate, zoom, and save or transmit as an electronic file. Panoramas and object models were also integrated into the GIS.
Three-dimensional CAD drawings of the aircraft were received from the aircraft manufacturer in Unisis format. CAD modelsFootnote 4 of the aircraft structure were developed to depict the orientation and estimated temperature of specific components. Using the GIS coordinate system, these models were cross-referenced to panoramas, object models, photographs, and textual information about recovered components. This supplementary information could be retrieved by positioning a cursor over the CAD representation of the component of interest. Investigators used these tools to analyze the routing and orientation of various components, to review temperature patterns, and to develop airflow and fire propagation scenarios.
Standard Internet browser utilities were used to view CAD presentations, object models, and panoramic images. Panoramas and object models use a common image formatFootnote 5 as a texture for a Virtual Reality Modelling Language 2.0 environment. The Flashpix® image format uses streaming technology and was specifically designed to provide high-resolution images over the Internet. The panorama or object file can be exported as an IVR file to a web browser plug-in that interprets the file, enabling the images to be viewed in an HTML environment. In this way, investigators were able to access, rotate, and zoom two-dimensional panoramas and object models of the aircraft interior and to navigate from one perspective to another using a standard web browser. The Whips 2-D viewer and Voloview 3-D viewer, both by Autodesk Incorporated, provided a similar capability to view CAD drawings with a web browser.
PRODOCs application
The TSB developed the PRODOCs application to provide a single point of access to investigation data from the Evidence and Reports III database, the SUPERText® database, Document Control Log database, and the photo database. It also provides links to other related resources and applications, including the CSRTG accident database, technical notes, photographic panoramas and object models, two-dimensional and three-dimensional CAD diagrams, and video clips of various investigation activities.
Speech micro-coding analysis
Numerous studiesFootnote 6 have demonstrated a strong relationship between language use and human performance. In aviation, positive correlations exist between the verbal communication characteristics of flight crew members and ATC and flight outcome measures. An in-depth analysis of the verbal communication obtained from the CVR and ATC tapes was conducted to assess, as objectively as possible, crew interactions including crew coordination, workload, and problem solving in handling the emergency. Using contemporary communication theory and researchFootnote 7 and previous experience, a speech micro-coding protocol was refined to classify verbal communication segments in order to derive and analyze relevant data. The protocol was applied in the context of Swissair procedural information, FDR data, and the ATC MANOPS to analyze the verbal communication relevant to the objectives listed above.
Cockpit crew communications were partitioned into VTUs. VTUs are utterances dealing with a single thought, intent, or action. A single sentence may contain more than one VTU. Each VTU was then coded according to the time of onset, the speaker, the target, the speech form employed, a qualitative descriptor, and an action decision sequence.
The time of onset was measured in CVR time minutes. A time latency factor was included to indicate the time between the onset of one VTU and the onset of another. This factor was helpful in determining not only the rapidity of the expected response but also the connection between the VTUs. The speaker was the originator of the communication and the target was the intended receiver. Each VTU was classified according to a particular speech form and qualitative descriptors were used to evaluate the adequacy and appropriateness of the communication. Action decision sequences were used to link the VTU to an event requiring coordinated action among crew members, interaction external to the cockpit (e.g., ATC), or both.
The following nine speech forms were used to classify the VTUs.
- Command: A clear instruction to act in a specified manner.
- Advocacy: A suggestion to act, given as a suggested approach.
- Observation: A non-directed comment giving information related to a current or anticipated condition or state.
- Acknowledgement: A statement of concurrence or an indication that information has been received, given in response to a command or observation.
- Inquiry: A request for information or direction.
- Reply: A meaningful response to an inquiry.
- Identification: A greeting or identification/acknowledgement of the speaker.
- Exclamation: An expression of surprise or emotion.
- Alert: Information indicating a condition of heightened concern or preparation for action.
Coding of speech forms can provide valuable insight into communication dynamics. Speech forms describe the variety of communications modalities available to the communicator.
Using this technique, the VTUs are qualitatively coded to determine the effectiveness of the verbal communicationFootnote 8 among the flight crew, between the flight crew and the flight attendants, and between the flight crew and ATC. Some of the VTUs can represent miscommunication; that is, the utterances might be incomplete, ineffective, incorrect, or inferentially changed and were coded as such. Often in communication, the response to a question may be delayed because the recipient of the question does not know the answer and must expend time gathering information to respond, other tasks may have priority, or the recipient may be fully occupied with another task that needs immediate attention. The risk of delayed communication is that other events take priority and the original request may be lost. The term "deferral" is included as a descriptor to capture and track communications of this type. To also capture the dynamics of the trans-cockpit authority gradient, communication is coded as "deferential" when the communication indicated deference to authority, and "take over" when the communication expected of one crew member is executed by the other crew member.
The following qualitative descriptors were used to classify the VTUs:
- Incomplete: A communication devoid of meaningful content owing to poor communication style or a break in verbal transmission.
- Ineffective: Communication that is not appropriate for the situation and does not achieve the intended goal.
- Incorrect: A reply that is clearly incorrect, such as an incorrect read-back or a response that does not answer the question posed.
- Inferential change: Communication wherein the meaning or intent of a communication that has been received is changed.
- Deferral: A reply to an inquiry indicating that the answer will be forthcoming.
- Deferential: Communication intended to indicate deference to authority.
- Take over: Communication to ATC Tower by one crew member where one would reasonably expect it to be made by the other.
Coding the action decision sequences enabled an analysis of how task focus, as measured through verbal behaviour, was distributed across crew members. These sequences are communications linked to an event that required coordinated action among crew members, interaction external to the cockpit, or both. Coding the sequences in this manner enables crew interaction to be reduced into a relatively limited number of behavioural sequences that effectively capture the multiple tasks faced by a crew.
The following descriptors were used to code the action decision sequences:
- Flight control: Actions related to handling the aircraft.
- Nav control: Decisions relating to the flight path of the aircraft.
- Damage assessment: Assessment of the nature and extent of damage to the aircraft; identification of operational and non-operational systems.
- Problem solving: Operational communications addressing problem solving; corrective actions, completion of abnormal checklists.
- Landing: Identification of potential landing sites, location of alternatives, non-standard or abnormal landing preparation.
- Emergency preparation: Emergency landing, cabin preparation, reporting persons on board and fuel, non-standard requests for support.
- Social: Non-operational communications addressing social-emotional and team-building concerns, introductions, tension release, affective support.
In order to allow tabulation of the number of codings per unit time, the CVR was segmented into equal segments of 2.5 minutes of CVR time.
Much of the CVR is a record of voices and sounds recorded on the CAM channel. CAMs typically give a poor signal-to-noise ratio because of the distance to the microphone from the speaker and the level of steady-state ambient noise in the cockpit. In terms of communication data, voice recordings are limited in that they give little non-verbal communications information. The influence of the crew's dialects, combined with the low signal-to-noise ratio, in particular from the CAM, also resulted in ambiguous interpretations of a few phrases.
The potential influence of ambiguous data on the speech micro-coding and analysis process was mitigated by implementing the following guidelines:
- Acknowledge ambiguities in the data and develop procedures to deal with them.
- Use the procedures consistently.
- Do not use data for analysis if it is ambiguous.
- Note that most of the available data comes from verbal behaviour only; just because nothing is heard does not necessarily mean that nothing was communicated.
- Assume that the ambiguities will be evenly distributed across the record, although there may be an oxygen mask effect (i.e., the mask has a hot microphone that may give a better recording quality).
- As this analysis is largely a classification exercise, recognize the limitations inherent in the chosen definitions and categories (note how Observation was divided into two categories: Alert and Observation).
- Note the trade-off between the number of categories used and accuracy—the fewer the categories, the more the groupings lack analytic definition; the more categories that are used, the more likely it is that there will be too few data points in each to enable meaningful analysis.
- Analyze cabin crew conversations only if cabin crew members were interacting with flight deck crew.
- Note the possible problem related to double counting repeated thought units.
Aircraft engine analysis
During the investigation of the aircraft engines, a need arose to determine the position of the spool valve within the body of the thrust reverser system HCU. The first option was to disassemble the unit. During disassembly, however, it is possible to alter the positioning of the spool valve and, in light of the corrosion that had developed from submersion in the ocean water, disassembly would have been difficult. Instead, the unit was transported to an industrial x-ray facility at 12 Wing Shearwater where it was subjected to an x-ray process. Analysis of the x-ray film easily identified the control valve position within the HCU body. The x-ray taken prior to disassembly documented the internal positioning of the components for reference purposes. This technique was also used to view the locking mechanism of the thrust reverser system locking actuators.
The on-site, external examination of the FMUs determined that the resting position of the sector gears differed between the three units, suggesting different fuel flows to each of the three engines at the time of impact. Physical examination of the engines also indicated different power settings. As the position of the sector gears is directly related to the position of the fuel metering valve and fuel flow, the FMUs were transported to the manufacturer for disassembly and examination. During the examination, the position of the fuel metering valve spool relative to the metering valve sleeve was measured and compared against the manufacturer's drawings to determine the fuel flow from these measurements. This information, along with information gathered from other areas of the engines, helped to determine the approximate thrust setting for each engine at the time of impact.
The VSV control subsystem provides maximum compressor performance by moving the HPC inlet guide vanes and fifth-, sixth-, and seventh-stage HPC vanes to their programmed positions in response to commands from the FADEC. During an engine start, the VSVs may be in an open position until approximately 15% N2, at which time they would close. At speeds above approximately 40% N2, the VSVs modulate to open with increasing N1 and N2 and are fully open at take-off and climb power. The vanes modulate with N1, N2, and Tt2 changes.
The three VSVs were transported to the manufacturer's facility for disassembly and examination. Measurements were taken from the centre of the piston face to the actuator aft housing surface. This measurement was used to determine the position of the piston relative to the piston full stroke. The results of this calculation were then interpreted to provide the engine thrust level. This information, along with other factual information gathered from the FMUs and bleed valves, helped to establish the thrust levels of the SR 111 engines at the time of impact.
The 2.5 bleed air subsystem increases compressor stability during starting, transient, and reverse thrust operation. The 2.5 bleed valve is connected to an actuator through a bell-crank, and when the valve is open, it releases fourth-stage LPC air into the engine fan airstream. It is controlled by the FADEC as a function of TRA, N1, N2, Tt2, M, and altitude. During an engine start, the valve is commanded fully open and will begin to close at approximately 84% N2. If a surge is detected on an engine, the valve is commanded fully open. This valve is also fully open during reverse thrust operations on the wing engines, but only half open on the tail engine.
The three bleed valves were disassembled and examined at the manufacturer's facility. Measurements were taken from the mounting surface of the housing to the end of the piston to determine the "as-received" position of the piston. This measurement value indicates the position of the piston relative to the fully extended position, and thus reflects the percentage of its full stroke. This percentage reflects the engine thrust level in engine revolutions per minute at the corrected low pressure rotor speed. These values were not used in isolation, but along with other factual information gathered from the engine examination.
The 2.9 bleed valves, located at the ninth-stage HPC, improve compressor stability during starting and transient operation. The FADEC controls the left 2.9 stability bleed valve as a function of corrected N2, altitude, and time, and controls the right 2.9 start bleed valve as a function of corrected N2. During an engine start, both valves are open. At approximately 2% N2 below idle speed, both valves close. If the FADEC detects a surge at any time, the left valve opens. The left valve also opens for up to 180 seconds if the engine is decelerated below approximately 81% N2 and the altitude is between approximately 16 000 and 20 000 feet. It closes upon acceleration. The valves are spring loaded open and commanded closed by the FADEC.
Visual examination of the six 2.9 bleed valves determined whether the valves were open, closed, or jammed in a position as a result of impact. This information, along with other factual information, helped to determine thrust levels when the engines struck the water. (STI)
The FADEC is the source of stored information that is particularly useful for investigating accidents in which the FDR has stopped, as it did near the end of the SR 111 flight. The information may be downloaded from the FADEC NVM at the manufacturer's facility. If the time reference captured on the NVM can be accurately related to actual time, then engine faults stored in the NVM can help to determine the engine status during the accident sequence. If only airframe faults but no engine faults are captured in the FADEC NVM, then, if the FADEC was powered, it can be assumed that there were no deficiencies associated with the engine. The airframe faults, especially faults written to the FADEC about components that provide input data to the FADEC, may help to establish the engine mode of control at the time of the occurrence. The stored airframe faults may help to establish the serviceability of the airframe during the accident flight. Analysis of the FADEC-stored faults determined the SR 111 mode of control of the engines and also provided some altitude and time reference information during the last minutes of flight.
Auger electron spectroscopy
AES is a forensic technique that was used to help differentiate between electrical wire arcs that could have caused a fire and arcs that resulted from a fire. The technique is based on the premise that combustion by-products are trapped in the re-solidified copper that is briefly melted when the electrical arc occurs. As the melted copper solidifies, it forms a bead at the site of the arc. Gases can be trapped near the surface of the metal because of its high solubility and rapid cooling. If the arc precedes the fire, the host atmosphere will be relatively clean and oxidizing. The near-surface composition of the arc bead will, therefore, exhibit relatively low levels of hydrocarbon contaminants and trapped combustion gases. Conversely, if an arc occurs when a fire is in progress, the near-surface chemistry of the arc bead will include a complex mixture of gases and particulates from the combustion of various materials and lower levels of oxygen. Depth profiling of the near-surface chemistry of arc beads is a critical factor in discriminating between arc beads that were formed in clean or contaminated environments. In all cases, when exposed to a fire environment, the arc beads will be coated with a surface layer of hydrocarbon contaminates (soot). However, arc beads formed in a contaminated environment will contain combustion by-products to a depth of at least 500 Ǻ, which is a distinguishing characteristic.
AES analysis is limited to metallic melt surfaces that are smooth, flat, and have no porous regions or crust. Because arc melts with an irregular surface geometry, porous regions or crust remnants are unlikely to have captured the chemical signature of the ambient environment when the arc was formed. An important first step in the AES process is the selection of suitable sites on the metallic melt surface for detailed analysis. Selected sites, typically small spots of less than 1 µm in diameter, are then probed to eliminate any foreign artifacts from the analysis volume. Knowledge of the vertical elemental profile, morphology, and porosity of selected arc sites is then obtained by combining AES techniques with FIB etching and TEM.
The TSB contracted with the CANMET Materials Technology Laboratory to assess the differences in the wire arc beads at the chemical/microscopic level between a bead formed in a pre-fire (clean) environment, and a bead formed in a fire (contaminated) environment. The objective was to determine whether it was possible to isolate an individual arced wire as a lead event in the SR 111 fire.
An initial proof-of-concept AES examination was conducted using 24 exemplar wires containing arc-produced beads that were created in controlled conditions. Under the direction and control of TSB investigators, these samples were created at Boeing Corporation, Seattle, from types and gauges of current-carrying wires that are typically found on the MD-11 aircraft. Of these wires, 14 were arced in a clean environment to replicate pre-fire conditions and 10 were arced in a fire environment. Before they were examined, five of the arced wires created in the clean environment were exposed to a fire environment. This was done to replicate such a potential fire scenario. Of the 14 wires that were created in the clean environment, 9 were correctly identified as such by AES testing. Of the five wires that were subsequently exposed to a fire environment, two were correctly identified as being originally arced in a pre-fire environment. Of the 10 wires created in a fire environment, 9 of these wires were labelled inconclusive and the tenth wire was incorrectly identified as having arced in a pre-fire environment. Wires that had been exposed to a fire environment were often coated with soot and combustion residue. This crust of contamination could not be completely removed without potentially influencing the test results. This resulted in many inconclusive AES test results for these wires. When evidence of post-arc heating was present on the wire specimen, the use of AES to distinguish between arcing causing a fire and arcing as a result of fire usually became inconclusive.
During the proof-of-concept test activity, the AES methodology for examining arc beads continued to evolve. A decision was made to proceed with the examination of electrical wires from SR 111 that exhibited areas of molten copper. It was believed that certain refinements to the AES process could provide valid information and increase confidence in the results.
The AES methodology was used to examine 21 wire and cable exhibits recovered from SR 111. Thirty-five suspected arc-melt zones were cut from the 21 wire exhibits and probed by AES, typically at two or more locations per specimen. Efforts to characterize individual specimens were hampered by several factors. For example, many of the SR 111 specimens were not simple spherical beads on a wire strand or wire bundle. The method of capturing and comparing information between beads required that an electron gun be aimed at the surface of each specimen at a consistent angle. The irregular morphology of the specimens made it difficult to find areas with sufficient similarity to obtain usable and comparable information. In addition, the SR 111 wire specimens had been submerged in salt water for many weeks and were coated with post-crash artifacts resulting from aqueous organic and inorganic bio-geochemical activity. The wire specimens were therefore subjected to rinsing and ultrasonic cleaning in demineralized distilled water in an attempt to remove the post-crash contaminants. However, it was not possible to fully remove all of the contaminants by this method and other cleaning methods were not used because of their potential to affect the validity of the AES test results.
During the preliminary AES analysis, it was determined that the copper melt regions on 3 of the 23 wire exhibits were not consistent with electrical arcing, thereby reducing the number of valid wire arc exhibits to 20. The preliminary AES analysis also identified 16 of the 35 original specimens as suitable for further analysis. The morphology and micro-structure of the surface and near-surface region of these 16 samples was examined using FIB sectioning and secondary electron imaging to determine whether cracks or pores were present. TEM was employed to examine seven FIB-generated lift-out samples.
A seawater testing program was undertaken to determine the effect of seawater exposure on AES-derived surface and near-surface chemical data. Baseline AES testing was also performed on arced wires recovered from an in-service MD-11 aircraft.Footnote 9 The supplementary information gathered through these exercises resulted in a better understanding of the source of key elements identified in the preliminary AES analysis, their distribution, and associations in the SR 111 arc specimens of primary interest. Additionally, the FIB and TEM examinations proved useful and complementary to the original AES study and resulted in re-examination of some AES data. Three of the eight specimens that were originally identified as having occurred in a pre-fire environment were subsequently reclassified as indeterminate.
The AES examination is supported by a full report: the Final Report to TSBC - Surface Chemical Analysis of Electrical Arc Residues Recovered from SwissAir Flight-111 Crash Site (MTL2002-50 (CF) dated February 2002, produced by MTL/CANMET.
Generation of exemplar arc beads for AES
Testing to generate the exemplar arc bead samples for the AES proof-of-concept was conducted at Boeing's Electrical Components Laboratory in Seattle, Washington between 17 and 21 August 1999. Representatives from the TSB, the FAA, the NTSB, Swissair, Boeing, Hollingsead, SBA, and IFT were in attendance.
A series of four tests, referred to as A, B, C, and D were conducted.
- Series A tests were conducted on wires with a section of insulation removed to allow arcing to 7075-T6 Al or arcing to each other at normal, sea-level air pressure. Out of the 30 tests, the CB opened (tripped) 15 times.
- Series B tests were conducted on eight wire samples with a section of insulation removed to arc to 7075-T6 Al at a reduced pressure of 8 000 feet. Out of the four tests, the CB opened (tripped) once.
- Series C tests were conducted on samples from the Series A and Series B tests that were placed in a chamber and burned with materials from the occurrence aircraft and aircraft stock material to simulate an arc bead that formed in a clean environment and was then subjected to a fire. These wire samples were not electrically powered during this test.
- Series D tests were conducted on wires that were placed in a chamber and burned with materials from the occurrence aircraft and aircraft stock material while the wires were electrically powered to simulate an arcing event caused by a fire. Out of the 13 tests, the CB opened (tripped) 10 times.
Two wire insulation types were used for the majority of the testing: MIL-W-81381/12, a fluorocarbon polyimide, nickel-coated copper rated at 600 V and 200°C (Boeing PN BXS7007-16) and MIL-W-22759/16, a fluoropolymer-insulated, ETFE, tin-coated copper rated at 600 V and 150°C. The majority of the testing was conducted with polyimide wires of 16 AWG and ETFE wires of 12 AWG. One test used 6 AWG polyimide wires and 10 AWG ETFE wires. The 10 AWG wire was Boeing Material Specification BMS13-48T08C01G10. All wire samples were built to two-foot lengths to accommodate the various test fixtures.
Test observations were compiled for series A, B, and D tests to document the type of wire used and the observed arcing characteristics, including the behaviour of the associated CB(s). Each test was photographed with a 35 mm camera and recorded on 8 mm or digital video (without audio).
Simulator trials
Four formal simulator trials were conducted in support of the investigation. It should be noted that all simulator trials were conducted in fully serviceable simulators. The simulator trials were pre-planned and briefed to meet specific objectives for known systems failures. Normal operational tasks associated with abnormal or emergency conditions, such as situation analysis, ATS communications, cabin crew communications, and approach planning, were intentionally not completed. The objectives of the trials were strictly limited to obtaining factual information.
The first simulator trial was conducted on 26 September 1998 on a MD-11 simulator at the Swissair training facility. Swissair provided two type-rated and experienced MD-11 pilots to operate the simulator for this investigative work. The left seat was occupied by an NTSB MD-11 qualified investigator and the right seat was occupied by a senior Swissair captain. A TSB senior operations investigator monitored these trials.
The objective of the first part of the exercise was to complete various checklists to get an understanding of the time, workload, and the systems available during the use of the checklists. As the Swissair Smoke/Fumes of Unknown Origin Checklist (Appendix C) was being completed, the pilots were required to don full-face masks and simulated smoke was injected into the simulator. During this drill, various CBs were pulled to simulate the loss of systems and services as denoted on the SR 111 FDR and CVR. The simulator pilots demonstrated how the simulator handled when flying with only standby instruments.
The objective of the second part of the exercise was to fly two scenarios. The first scenario was an approximation of the SR 111 flight path based on ATC and FDR information. The second scenario was to fly from FL330 at 60 nm back from the runway to approximate a straight-in visual approach for a generic Runway 06, with a slight tailwind. The pilots manually flew the simulator using emergency descent procedures, that is, with throttles reduced to idle power, speed brakes extended, and descending at the maximum allowable speed. Fuel dumping was initiated at the beginning of the emergency descent. The landing gear was extended at approximately 5 000 feet msl. This second scenario, from beginning to a full-stop landing, took approximately 13 minutes to complete.
The second simulator trial was conducted by Boeing in their MD-11 engineering simulator in Long Beach, California, on 10 October 1998 with a Boeing test pilot as the captain. The simulator scenario began from FL330 to a full-stop landing and evacuation at a generic airport (not Halifax). The emergency descent procedure described in the McDonnell Douglas Flight Crew Operating Manual, which prescribes the use of autopilot, was used for this trial. The test was performed in a fully functioning cockpit with no system or other failures introduced; it did not take into account any winds or aircraft weight and C of G changes due to fuel dumping. This simulator analysis showed that under normal conditions, it takes 13 minutes and 8 seconds to get from FL330 to a full-stop landing. Another 90 seconds is required for an emergency evacuation. This descent profile covered 66.5 nm.
The third set of simulator trials was conducted again in the Swissair MD-11 simulator in Zurich on 17 May 1999. The left seat was occupied by a Swissair captain and the right seat was occupied by a TSB investigator familiar with the MD-11. A Swiss AAIB investigator also attended. Three separate scenarios were completed. The first scenario was a descent from FL330 at 58 nm to a generic runway with no slats, no auto-brakes, and no smoke or masks. The captain had to complete "S-turns" to lose altitude, but managed to land straight-in on the runway. This scenario took 13 minutes and 40 seconds to complete. The emergency descent checklist was used for the profile. Fuel was dumped from the beginning of the descent and the autopilot was disconnected after 9 minutes. The second scenario began at FL330, 70 nm from the runway using full-face masks with no slats and no electric pitch trim. Fuel dumping started 1 minute and 25 seconds into the descent, the Swissair Smoke/Fumes of Unknown Origin Checklist (Appendix C) was used, and a visual landing was completed using the stand-by flight instruments 15 minutes after the initiation of the descent. The third scenario was the same as the second except that in this scenario, the landing was conducted to a runway opposite to the runway used in the first and second scenarios and the autopilot was turned off after 12 minutes. The scenario took 15 minutes and 30 seconds.
The fourth simulator trial was conducted in Zurich in a Swissair MD-11 simulator on 10 November 2000 as part of the systems group meeting. The simulator was set to the atmospheric conditions, aircraft performance, and aircraft configuration similar to those of SR 111 at various recorded times during the last 30 minutes of flight. Electrical system failures that were recorded on the FDR were introduced to determine the effect of these failures on other aircraft systems, system displays, and warning alerts provided to the crew. Still and motion photographs of the panels, pedestal, and DUs in the cockpit were taken when these failures were introduced. The SMOKE/ELEC AIR selector was rotated to various positions after the failures were introduced.
Another test was designed to determine the flying handling qualities of the MD-11 in the event of LSAS failure and complete electrical failure. This test was not designed to test stability and control (as in engineering flight tests); it was designed to determine whether the flight crew would have been able to fly the aircraft. The handling quality tests demonstrated that the simulator (and hence the aircraft) was flyable with only one channel of the LSAS, with no LSAS, and with no electrics. When no automatic pitch trim was available, trim changes were made using the manual pitch trim. None of these conditions would have made the aircraft unflyable.
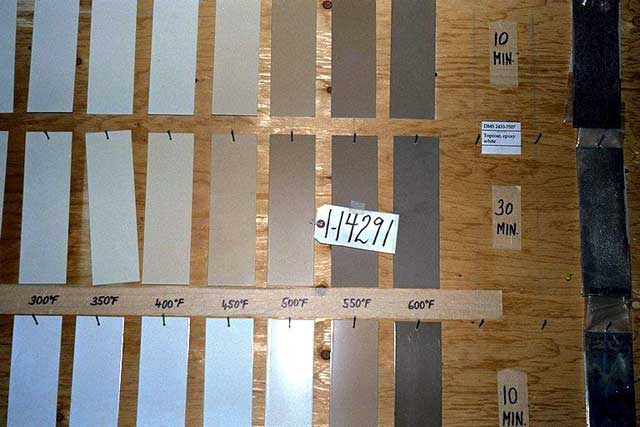
Temperature reference coupons
Pieces of the recovered aircraft structure, air conditioning ducting, ceiling panel, electrical components (e.g., wires, modular blocks, battery box, PVC-coated bus bar, clear plastic conduit), and other materials in the front ceiling area exhibited indications of heat damage. The severity of the observed heat damage to the aircraft structure frames, ducting, and electrical components was characterized by comparing the SR 111 recovered pieces to temperature reference coupons. The reference coupons were cut from the following recovered materials: aircraft structure (including frames and stringers), air conditioning ducting, battery box metal, conduit, module connector blocks, PVC-coated bus bar, grey wire sleeving, ceiling panel, and cockpit seat cover. Coupons made from new aircraft structure material were also obtained and were painted to the manufacturer's specification. New material wire samples were also provided. All of the coupons were then heated in a controlled environment at a pre-set temperature for fixed periods of time. Each reference coupon was characterized by a discolouration indicating the temperature and duration of exposure. After they were heated, the aircraft structure coupons (frames and stringers) were immersed in sea water to determine whether sea water immersion affected the discolouration. The effect was determined to be negligible.
Recovered wreckage that exhibited heat damage was compared to temperature reference coupons constructed from identical material to determine the approximate temperature and duration of exposure. Metallurgical analysis was subsequently performed on new samples of aircraft structure that were heated to determine the effect of heating on the microstructure of the various recovered samples.
Soot and colour reference standards
To consistently document and characterize colour patterns and the general degree of soot accumulation for comparison and analysis purposes, Kodak®Footnote 10 Colour Control Patch Cards and Kodak® Gray Scale Cards were used. These cards are available in different sizes: Kodak® Q-13 (small: 8 x 2 3/8 inches) and Q-14 (large: 14 x 2 7/8 inches).
The Kodak® Colour Control Patch Cards were used by investigators as a quality control device and colour reference standard. The cards were sometimes placed within the field of view in video, digital, and photographic imagery recordings. The cards display known print colours and markings that were used as a measurement reference scale. They were used to check and to correct colours, as well as to colour balance imagery taken for investigation and analysis purposes. To provide a repeatable reference, these colour control patch cards are printed using accredited SWOP®Footnote 11 inks on Kimdura paper stock. Solid ink densities are within SWOP® specifications. Markings include a three-colour combination of equal values of cyan, magenta, and yellow. Lighter colours represent a press quality result approximating nominal quarter tones within 25%. The background on the cards approximates 18% grey to neutralize flare and adjacency effects.
Kodak® Gray Scale Cards were also used by investigators as a quality control device and reference standard. The cards were sometimes placed within the field of view of imagery taken. The cards can be used to compare known tone values with reproduced images. They can also be used to compare exposure and processing in a photographic environment so that changing conditions can be identified, measured, and controlled. The cards assist in "balancing" negatives and positives through a traditional colour reproduction process that requires the use of masks, separation films, and filters. They also provide a reference to determine values for plotting tone reproduction curves. The cards display 20 labelled density steps measured in 0.10 increments and relative density values from a nominal "white" value of approximately 0.05 to a "black" value of 1.95. Kodak® labels the density steps with either a letter or number. The numbers increase in sequential order from nominal "white" to "black." Nominal "white" is labelled with the letter A; the next density step toward "black" is labelled with the number 1. The density steps thereafter are numbered sequentially to the step that would be number 7, which is labelled with the letter M, then to the step that would be number 16, which is labelled with the letter B, then to the final step, which is labelled number 19. Density increments are tightly controlled and vary only slightly from the nominal density value. Neutrality and uniformity are also tightly controlled. Like the Kodak® Colour Control Patch Cards, the background approximates 18% grey to neutralize flare and adjacency effects.
The Kodak® Gray Scale Cards were also used as a reference to define the degree of soot accumulation on aircraft wreckage. Soot deposits was identified as "light," "moderate," or "heavy" according to their resemblance to the opacityFootnote 12 of the numbered density steps within the following ranges: number 1 to number 5, number 6 to number 8, and number 9 to number 19. To assist in determining whether a discolouration was in fact a soot deposit and not a colouration or discolouration in the base material itself, swabs were dipped in a water-based detergent and then rubbed on the surface of the specimen. If the discolouration was removed by the swab, then the discolouration was assessed as likely being a soot deposit. If the discolouration was not removed by the swab, then the discolouration was assessed as likely not being a soot deposit.
Map lights
In April 1999, Swissair initiated a program to replace MPET-covered insulation blankets with Insulfab 330 insulation blankets in critical zones throughout their MD-11 aircraft. In August 1999, the TSB commissioned the Swiss AAIB to monitor the replacement of the partial replacement of MPET-covered insulation blankets on Swissair MD-11 aircraft. In December 1999, the AAIB observer identified a damaged map light, PN 2LA 005 916-00, manufactured by the Hella Aerospace company. This map light was likely damaged as a result of overheating. The insulating cap, located at the rear of the light fixture and manufactured from black Victrex® polyethersulfone 4100G, exhibited cracks. The red insulation of the cable terminal exhibited dark discolouration and was cracked along its length. The map lights above both pilots' positions were in direct contact with the MPET-covered insulation blankets above them; these insulation blankets exhibited dark discolouration in the vicinity of the contact. During a subsequent visit to the SR Technics electrical workshop, the AAIB secured a map light (SN 656) that exhibited short-circuit traces between the contact spring of the bulb and the map light frame.
On 15 December 1999, the Scientific Forensic Service of the Zurich Police was asked to analyze the damaged map light components and MPET-covered insulation blankets and reached the following conclusions:
Damage to the FCRL [map light] insulating cap and cable terminal insulation were mechanical fractures, originating from internal mechanical stresses. These fractures occurred because of the increased brittleness of the insulating material as a result of prolonged exposure to high temperatures.
The temperature in the areas behind the FCRL was between 77°C and 160°C.
The contact springs of the lamp holder of the FCRL exhibited traces of at least 3 electrical arcs between the contact spring and the frame. The arcs generated temperatures of 4 000°C to 5 000°C, causing melting and transfer of the metals.
In May 1999, Hella Aerospace and Boeing exchanged information about a problem with the map light installed in MD-11 aircraft, PN 2LA 005 916-00. Hella subsequently conducted tests to measure the heat originating from the map light. As a result of these tests, Hella proposed that the map light's 11.5 W halogen lamps be replaced with 7 W incandescent bulbs. This new version of the map light was designated PN 2LA 005 916-10.
The following conclusions were drawn from the map light tests conducted by Hella Aerospace:
Mechanical effects alone did not generate the same types of damage found on the black insulating caps (Victrex® polyethersulfone 4100G) in the MD-11 aircraft.
In the case of a severely damaged or missing insulating cap, it is possible that a short-circuit may occur between the contact spring of the bulb and the carrier frame of the map light. The arc traces generated during these tests on the carrier frame and contact spring compare well with the arc traces on the map light from a Swissair MD-11.
Vibrations can extend the duration of the arc to approximately 200 ms. The modified characteristic of the short-circuit means that the CB often does not respond.
The arc between the contact spring and the carrier frame of the map light is capable of burning a hole of some millimetres in diameter, at room temperature, in an MPET-type cover material located above the map light. In the tests, however, the MPET-type cover material did not ignite.
The discolouration of the MPET-covered insulation blankets observed on the Swissair MD-11 aircraft could not be reproduced in the course of the long-term tests conducted at Hella Aerospace.
The long-term test was subsequently repeated in an environment that reproduced the installation environment in the MD-11 more accurately than the original test. In the second test, the Hella map light was operated in a confined space in which the light fixture was in contact with, and surrounded by, MPET-covered insulation blanket material. During this test, temperatures in the confined space stabilized at 150 to 160°C; the maximum recorded temperature was 163°C. After two months of continuous testing, the inside of the MPET-covered insulation blanket exhibited clear brown discolourations similar to those found on the insulation blankets installed in the MD-11 behind the map light. In addition, the insulation on the terminal cable was clearly discoloured and partially fractured and the black insulating cap exhibited a crack similar to those frequently observed on the map lights installed in MD-11 aircraft. After six weeks of exposure to temperatures of approximately 160°C, the Victrex® polyethersulfone material from which the insulating cap was fabricated was brittle and had lost its original strength. Information provided by the manufacturer estimated the half-life cycle of Victrex® polyethersulfone (at 180°C) to be 160 000 hours or approximately 18 years.
In May 2000, temperature measurement strips were installed on the MPET-covered insulation blankets behind the map lights in three MD-11 aircraft. These strips were used to record the maximum temperature on the surface of the insulation blanket during flight operations. In June 2000, the temperature strip recordings were documented on two of the three aircraft; the strips on the third aircraft had been overlaid with PET splicing tape and rendered useless. On the two aircraft where temperature readings could be recovered, a maximum in-flight temperature of 77°C was recorded and there was no thermal damage to the MPET-covered insulation blankets behind the map lights. In addition, the MPET-covered insulation blankets did not exhibit severe impressions, such as those typically caused by the rear of the map light pressing against the blanket. It was determined that the conditions present in the aircraft equipped with temperature strips were not likely the same as in other aircraft that have been inspected. In particular, there appeared to be more space between the map light and the MPET-covered insulation blanket, which resulted in better ventilation around the map light and, therefore, a lower ambient operating temperature.
Airflow flight tests
Two separate flight tests were conducted under various conditions to assess airflow directions in the spaces above the cockpit and cabin ceilings. The first test was conducted by the TSB on 27 January 2000 in Long Beach, California, using Swissair aircraft HB-IWE. The second test was conducted by Swissair and Boeing on 2 December 2000 in Zurich, Switzerland using Swissair aircraft HB-IWE. The test was monitored by the Swiss AAIB on behalf of the TSB. The primary objective of the second test was to determine potential locations for dual loop smoke detector installations.
Seven primary smoke release points and eight video camera locations were selected for the Long Beach flight test. One smoke release point was in the cockpit, outboard of the upper avionics CB panel. A second release point was in the avionics compartment under the engine fire shut-off cable drop. The remaining five release points were above the forward cabin drop-ceiling—above the emergency lights battery pack at STA 403, at the left and right drop-ceiling support struts at STA 428, and at the left and right ceiling support struts at STA 477. One video camera was installed to view each of the seven smoke release points and the eighth was installed above the cockpit overhead diffuser looking aft.
Each smoke release point was ground tested and the direction of the smoke was monitored by the respective video camera. The avionics compartment exhaust fan was running, but the cabin recirculating fans were off during the ground testing. Smoke from the release points above the forward cabin drop-ceiling migrated forward and down the fire shut-off cable drop to the avionics compartment. The smoke from the release point outboard of the upper avionics CB panel was drawn down the ladder area to the avionics compartment.
For the test flight, the aircraft was configured with two cockpit foot warmers partially open and the remaining cockpit air vents closed. There was, however, airflow leakage through both the left and right overhead diffusers. The cockpit door was closed and the door louvres were open. All four recirculation fans and the gasper fan were operating. The cabin individual air eyeball vents were configured with 50% of the vents closed, 45% of the vents partially open, and 5% of the vents fully open. The tests were first conducted at FL330 with the smoke barrier sealed and then repeated with the smoke barrier partially open. Upon conclusion of the fixed-point smoke release testing, a hand-held Draeger tubeFootnote 13 was used as a mobile secondary smoke release unit below the ceiling in the cockpit and passenger compartment.
When smoke was released behind the upper avionics CB panel, it moved toward the ladder area where it disappeared from view, which is consistent with it being drawn down the ladder area into the avionics compartment. No smoke or odour was detected in the cockpit or in the cabin. Smoke released in the avionics compartment swirled and moved forward toward the avionics cooling fan filter but was not detected in the cockpit or cabin. This smoke movement is consistent with air flowing down the cable drop, causing the swirl, and then moving forward to the avionics cooling fan filter.
Smoke released above the emergency lights battery pack at STA 403 moved aft above the forward cabin drop-ceiling. Camera 8 also recorded some wisps and weak puffs of smoke coming from the smoke barrier area and travelling forward and outboard above the cockpit ceiling toward the ladder. Although no visible smoke was observed in the cockpit, a faint odour was detected. The origin of the odour could not be pinpointed. No smoke or odour was detected in the cabin.
Smoke released at the left drop-ceiling support strut at STA 428 with the smoke barrier sealed moved aft above the forward cabin drop-ceiling. A faint odour was initially detected in the L1 door area, aft Galley 1 and then in the corridor adjacent to Lavatory A. No visible smoke was detected in the cabin. No smoke or odour was detected in the cockpit. Smoke released at this location with the smoke barrier partially open moved aft above the forward drop-ceiling. No smoke or odour was detected in the cockpit or the cabin.
Smoke released at the right drop-ceiling support strut at STA 428 with the smoke barrier sealed moved aft above the forward cabin drop-ceiling. A fairly strong odour was detected in the corridor adjacent to Lavatory B. No visible smoke was detected in the cabin. No smoke or odour was detected in the cockpit. Smoke released at this location with the smoke barrier partially open moved aft above the forward cabin drop-ceiling. No smoke or odour was detected in the cockpit or the cabin.
Smoke released at the left ceiling support strut at STA 477 moved aft above the forward cabin drop-ceiling. No smoke or odour was detected in the cockpit or the cabin. Smoke released at the right ceiling support strut moved aft above the forward cabin drop-ceiling. No smoke or odour was detected in the cockpit or the cabin.
Using a hand-held Draeger tube, smoke was released below the ceiling along the top of the cockpit door, along the forward galley and lavatory walls, and along the top of the forward entry doors. The smoke migrated up through gaps in the ceiling from all locations. When shadow trim was removed from the gap between the top of Galley 1 and the adjacent ceiling panel, the smoke rushed through the gap.
When smoke was released using the Draeger tube above the ceiling panel aft of the cockpit door with the smoke barrier partially open, it was recorded on Camera 8 as it travelled above the cockpit ceiling toward the ladder area. During this test, an odour was detected in the cockpit but no smoke was observed. This test was not repeated with the smoke barrier sealed.
Smoke was released using a Draeger tube at various locations within the cockpit with the smoke barrier partially open and with the smoke barrier sealed. The position of the smoke barrier had no significant effect on the smoke flow in the cockpit. During the cockpit Draeger tube tests, no smoke was observed to exit the cockpit into the forward cabin entry area. Smoke released along the upper third of the cockpit door moved laterally to the right side along the top of the door. The smoke reached a stagnant area near the ceiling between the upper main CB panel and the cockpit door. Smoke released forward of the upper main CB panel was turbulent near the ceiling; none was drawn into the panel. Smoke released along the avionics CB panel was caught in the airflow from the right overhead diffuser and flowed down, dissipating near the bottom of the CB panel. Smoke released in the area between the avionics CB panel and the overhead CB panel swirled and was blown downward. Smoke released along the right-side emergency escape rope box moved aft. Smoke released along the overhead CB panel moved upward and aft. Smoke released above the pedestal moved slowly forward and slightly upward.
At the left of the overhead CB panel, smoke was released along the upper edge of the left cockpit ceiling liner. This smoke was affected by the airflow from the left overhead diffuser and swirled around in front of the coat closet and beside the two aft windows on the left side. Smoke released along the upper forward face of the coat closet moved downward and outboard, migrating into the swirl region by the windows. Smoke released within the coat closet emerged from the closet moving in two different directions. Part of the smoke moved forward into the left-side swirl area, and part of it moved across the upper third of the cockpit door. Smoke released immediately forward of the cockpit door louvres drifted forward and slightly downward.
This airflow test was limited by the low volume of smoke released at each location. The airflow test was further limited by the long length of tubing required to deliver smoke to the avionics compartment and by the fact that the smoke release tubes at STA 428 right and STA 477 left had been partially kinked during the installation. The partially kinked tubes were discovered during a post-flight inspection of the equipment. Despite these limitations, there was sufficient smoke to provide indications of smoke movement.
The Zurich flight test configuration had 16 primary smoke release points and 10 smoke detectors, but no fixed video camera locations. Three smoke release points were located above the cockpit ceiling: on the forward left side, at the right overhead diffuser duct, and on the aft right side of the cockpit. There were six smoke release points above the forward cabin drop-ceiling. One was located above the emergency lights battery pack at STA 403, the second was located at the right drop-ceiling near STA 428, and the remainder were located near STA 500—one on the left side, one on the centre, and two on the right side. The remaining seven release points were located at various locations in the avionics compartment.
The aircraft was configured with a CTT Systems Zonal Drying® System operating above the cabin ceiling. The cockpit door was sealed and the door louvres were closed. The tests were conducted at FL370 with the smoke barrier sealed. All four recirculation fans and the individual air fan were operating for the first part of the flight test. During the flight recirculation, fans 1 to 3 stopped operating. Thirty-four smoke tests were conducted: 12 above the cockpit ceiling liner, 7 in the avionics compartment, and 15 above the drop-ceiling.
The first eight tests were conducted with smoke release points above the drop-ceiling and with all four recirculating fans operating (ECON ON configuration). Although the smoke flowed predominantly aft, some smoke moved forward. Smoke entered the cockpit from the coat closet when it was released at either the battery pack location or at one of the STA 500 right locations. No smoke was observed in the cabin area during these tests.
The remaining seven smoke release tests above the drop-ceiling were conducted with the recirculation fans selected off (ECON OFF configuration). Smoke flowed predominantly toward the engine fire shut-off cable drop. Smoke released from the STA 500 left location entered the cabin in the vicinity of the L1 door but was not observed in the cockpit. Smoke released from the STA 500 centre location entered the cabin in front of Galley 3 but was not observed in the cockpit. Smoke released from the STA 428 right location and from one of the STA 500 right locations entered the cabin in front of Galley 3 and also entered the cockpit from the coat closet. Smoke entered the cockpit from the coat closet when it was released from either the battery pack location or at one of the STA 500 right locations but was not observed in the cabin.
Smoke released at each of the seven release points within the avionics compartment moved forward to the avionics cooling fan filter. No smoke was observed in either the cockpit or the cabin during the smoke release tests within the avionics compartment.
The final 12 tests were conducted using the 3 smoke release points above the cockpit ceiling liner. Although in the first five of these tests the ECON switch was selected in the ON position, only one of the aft recirculation fans was operational. In the remaining seven tests, the ECON switch was selected to the OFF position. The volume of smoke through the hoses to the cockpit area release points was reduced because the fan in the smoke generator could no longer deliver the desired volume of smoke. Smoke released at the forward left cockpit location entered the cockpit from the cockpit liner adjacent to the left window diffusers independent of the diffuser air valve position. Smoke released at the forward right cockpit location entered the cockpit from the overhead panel during one of the seven release tests. Smoke released at the aft right cockpit location entered the cockpit as thin smoke from the fire handles in the overhead panel during one of the three release tests.
Computer fire modelling
Pre-fire airflow modelling
The area selected for the CFD fire field model was primarily comprised of the cockpit interior and cockpit attic airspace, as well as the attic airspace above the forward cabin drop-ceiling and first-class ceiling areas. The fire field model extended from approximately STA 275 to just beyond STA 755.
The CFD fire field model was constructed from a simplified version of the detailed, three-dimensional CAD aircraft model that had been built during the course of the investigation. CAD graphic elements were simplified to reduce the complexity and size of the original electronic files, while still retaining important three-dimensional features (i.e., curves and shapes were reduced to more basic surfaces and line segments). FSEG created an unstructured mesh from the simplified files to divide the aircraft and its contents, including airspaces, into a series of small, elemental volumes or cells. The unstructured mesh allowed for complex, irregular geometries to be efficiently meshed without body-fitted coordinate grids. Each cell typically resembled a cube measuring approximately 1 cm (0.4 inches) in size in the vicinity of the cockpit and increased in size to approximately 10 cm (3.9 inches) in the vicinity of the recirculation fans. Each cell was assigned properties for the item or material that it represented. For example, the thermal conductivity values for air, metals, insulation blankets, elastomeric end caps, hoses, and duct joints were entered into the SMARTFIRE® software code.
Based on FSEG’s CFD fire field modelling expertise and assessment, some small objects or features the effects of which were considered to be of little consequence in the fire were either removed from the model or represented by a further simplified shape. Some very small details such as slits, seams, or cracks (the width of which were smaller than the smallest cell of the mesh) were incorporated into the computer model by utilizing an "effective area" approach. For example, the seam located along the top, inboard edge of the avionics CB panel was represented by a line of small cells placed sequentially, one behind the other. The effective area of this virtual seam, which was shorter in length than the actual seam, was made to correspond to the total area of the actual seam. Hence, the effect of airflow leakage through a small opening was modelled by representing the small flow through the same effective area.
The video imagery taken during the first flight test conducted by the TSB on 27 January 2000 in Long Beach, California using Swissair aircraft HB-IWE was analyzed to determine airflow direction and speed (i.e., to determine airflow velocity vectors). The video imagery for the Zurich flight test was not used for this analysis, since video cameras had not been installed above the cockpit ceiling liner and forward cabin drop-ceiling.
The position of each fixed-mounted flight test video camera was determined and plotted in three-dimensional CAD. Some segments of video footage taken inside the cockpit with a hand-held video camera were also analyzed. The location of the hand-held camera was determined and plotted in three-dimensional CAD using perspective image analysis techniques. Specifications were obtained for cameras and lenses. The field of view for each camera was calculated and then checked by examining video footage to assess the actual field of view based on visible aircraft features. The fields of view were then plotted in three-dimensional CAD.
The path of the smoke released during the flight tests was tracked across the field of view of the cameras. The path of the smoke was then related to aircraft features and to the three-dimensional CAD fields of view in order to derive a three-dimensional path in CAD. The distance that a puff or wisp of smoke travelled in a segment of video footage was measured in three-dimensional CAD; the time that it took to travel this distance was calculated from the time code recorded on each video tape. The speed of the airflow transporting the smoke was calculated by dividing the distance travelled by the time of travel. Thus, the airflow magnitude and direction in three-dimensional space (i.e., the velocity vector) was determined at different locations using the flight test video cameras.
Boeing provided estimated MD-11 cockpit airflow balance values (e.g., conditioned air supply rates into and out of the cockpit) for different flight cases. The values provided for the case that best represented the occurrence were used to set the initial airflow settings in the CFD fire field model. The model was then run and the velocity vectors and flow rates were studied at different locations within the virtual aircraft. Some adjustments were made to the flow rates until the model’s velocity vector values closely matched those calculated from the flight test video cameras. The airflow patterns in the computer model were then compared to the smoke release flow patterns recorded on the flight test video tapes. The airflow patterns in the computer model were determined to be consistent with the smoke release flow patterns on the video tapes.
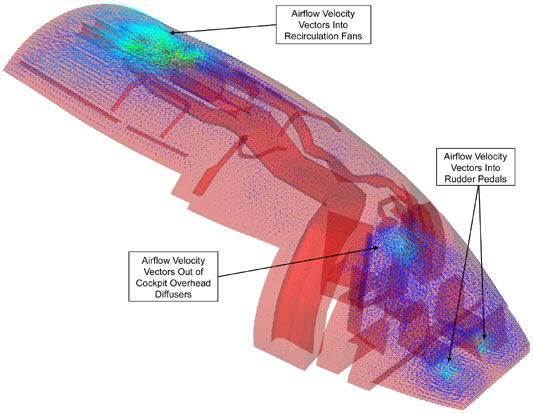
This illustration shows an example of an airflow pattern within a simplified CFD fire field model in which most interior items not shown in order to display vector arrows more clearly. The size of the arrow is proportional to the magnitude of the velocity; that is, the larger the arrow, the greater the airflow velocity.
Once the most representative airflow conditions for the occurrence had been established in the fire field model, different parameters (e.g., flow rates) were varied to develop a better understanding of airflow behaviour. Analysis revealed that the cockpit was likely in a negative pressure state when the fire started, as was evident on the flight test video tapes. The tapes showed that smoke released into the cockpit near the open louvres in the cockpit door was not blown out through the door into the passenger cabin, but was drawn forward into the cockpit toward the flight crew rudder pedals. This flow pattern is consistent with a negative pressure condition in the cockpit, which would draw air from the passenger cabin into the cockpit through the open door louvres.
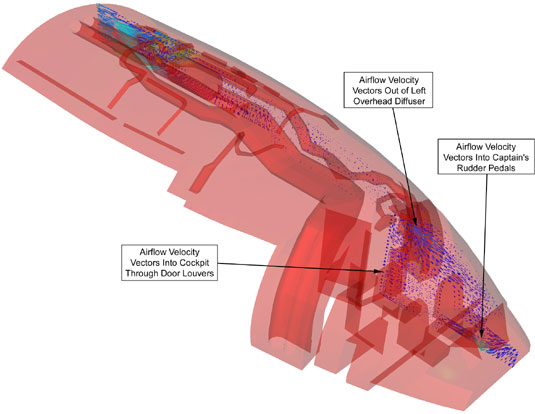
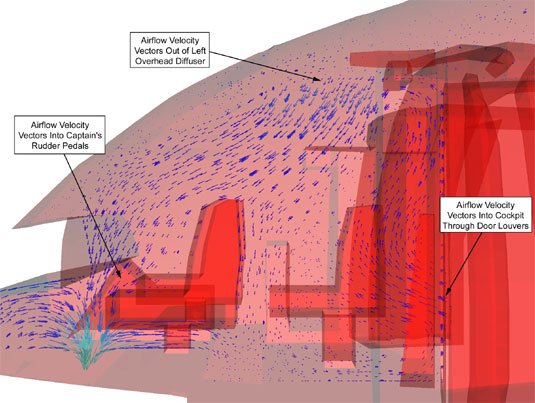
When the CFD fire field model was run using the most representative airflow conditions for the occurrence, airflow was drawn into the cockpit interior in the area of the avionics CB panel and migrated through the cockpit into the avionics compartment.
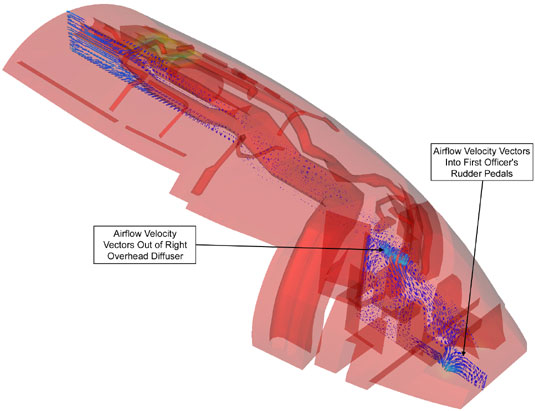
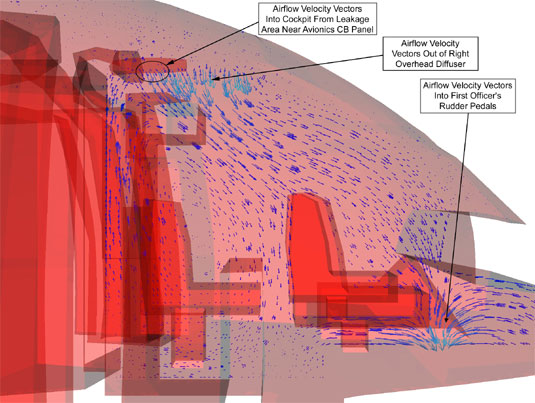
Fire modelling
Other properties were assigned to the small elemental volumes or cells of the CFD fire field model, including properties derived from burn test results. Such properties included ignition temperatures and heat release rates at different heat fluxes obtained from cone calorimeter and micro-scale combustion calorimeter testing. Engineering drawings were reviewed for insulation materials to determine details such as the shapes, thicknesses, and locations for the over-frame and between-frame insulation blankets, as well as the depth of the airspaces between them. The combined insulating effect for these different layers was entered into the SMARTFIRE® software code. Other information from sources such as the aircraft FDR was also used. This included data on the aircraft’s flight profile that showed the change of altitude, airspeed, and outside air temperature versus time. From this type of data, heat release and loss rate estimates for the in-flight fire were calculated and reflected in the computer fire field model.
Failure criteria and associated secondary effects were also incorporated into the fire modelling software for assemblies. For example, if a silicone, elastomeric end cap were ignited and consumed during the fire, its loss could trigger a change in conditions at that location. This could take place at the PN 9D0068-0300 end cap on the Galley 2 ventilation duct (near STA 388) or at the PN 9D0068-0350 end cap on the conditioned air branch duct just aft of the cockpit door (near STA 406). In the former case, an airflow rate into the opening created by the loss of the end cap would be triggered in the computer model, drawing air out of the aircraft. In the latter case, an airflow rate out of the opening would be triggered, supplying conditioned air into the aircraft. Similarly, failure criteria were also assigned to the smoke barrier assembly that would trigger the curtain portion of the smoke barrier to collapse. These criteria included ignition and destruction of the hook-and-loop fastener tape attaching the curtain to the curtain rod along the top edge of the smoke barrier. The possibility of melting and destruction of the nylon attachments (such as the MS 25281-R4 clamps) that attach the curtain rod to the aircraft frames was also considered.
Fires were ignited in the SMARTFIRE® software code and the potential effects of different variables were studied to develop a better understanding of fire dynamics for this occurrence.
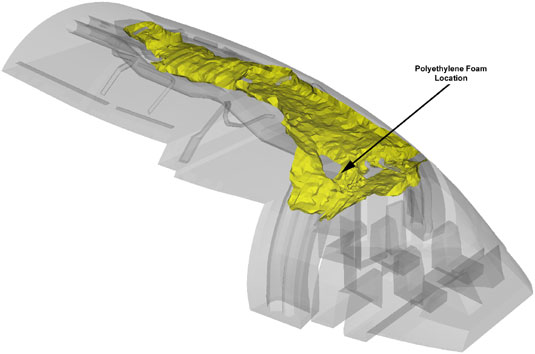
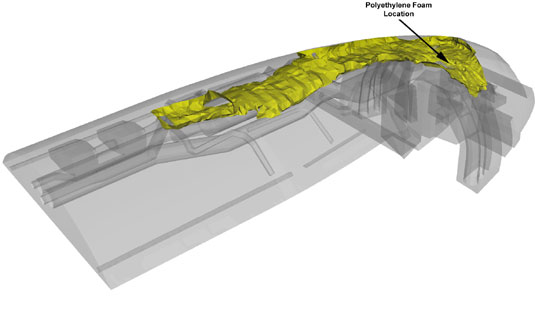
These illustrations show a sample formation of a smoke plume emanating from a fire in the riser duct area. Most of the aircraft interior items are not shown in order to display the plume more clearly.
The airflow modelling was used as a basis to set the initial, steady-state, pre-fire airflow conditions to represent the aircraft in cruise flight at FL330. A small fire was then ignited in the SMARTFIRE® software code on the underside of the over-frame, MPET-covered insulation blankets, near the aft end of the wire support bracket at the top of the ladder area, close to STA 383. This location corresponded to the vicinity of the forward arc on Exhibit 1-3791.
The CFD fire field modelling showed that the initial fire propagation and growth characteristics were consistent with the identified fire scenario. Although the fire modelling work reflected all stages of the flight, the analysis of the latter stages of the fire was limited as a result of the many permutations and combinations of possible events.
In-flight fire time study
The TSB conducted research on in-flight fires that occurred between 1967 and September 1998 on aircraft with a maximum take-off weight of more than 50 000 lb. The research included fires that took place inside the fuselage (i.e., in the cargo, cabin, cockpit, or in any combination thereof) and excluded engine fires, wheel well fires, and explosions (i.e., bombs). In 27 cases, it was possible to determine the stage of flight in which the initial indication of fire was detected. The first indication of fire could have either been detected by smell or by visually sighting smoke, fire, or both—whichever occurred first. It was determined that 63% of the in-flight fires were detected either during the take-off, climb out, descent, or approach phase; 37% of the fires were detected during the cruise phase. Of the 27 identified cases, there were 18 cases in which the aircraft did not carry out a successful landing (approximately 67%) as a result of either loss of aircraft control, ditching, or forced landing. In order to obtain a more accurate depiction of the amount of time available to the flight crew following the initial fire detection, research was conducted on only those cases in which the aircraft crashed, was ditched, or was force landed. Of those 18 cases that did not land successfully, it was possible to identify the elapsed time in 15 cases. The time from fire detection (i.e., the first sign of smoke or fire) to loss of aircraft control, ditching, or forced landing ranged from 5 to 35 minutes.