Aviation Investigation Report A12W0004
Runway overrun
1263343 Alberta Inc. (dba Enerjet)
Boeing 737-700, C-GDEJ
Fort Nelson, British Columbia
The Transportation Safety Board of Canada (TSB) investigated this occurrence for the purpose of advancing transportation safety. It is not the function of the Board to assign fault or determine civil or criminal liability. This report is not created for use in the context of legal, disciplinary or other proceedings. See Ownership and use of content.
-
Table of contents
Summary
The Enerjet Boeing 737-700 (registration C-GDEJ, serial number 32427) was operating as ENJ401 from Fort St. John to Fort Nelson, British Columbia. At 1117 Mountain Standard Time, during the landing rollout on Runway 03, ENJ401 overran the runway end by about 230 feet. There were no injuries to the 112 passengers or 6 crew members and no damage to the aircraft.
Factual information
History of the flight
Enerjet flight 401 (ENJ401) originated out of Calgary, Alberta, on the morning of 09 January 2012. The flight was being operated under Canadian Aviation Regulations (CARs) Subpart 705. The flight was sub chartered through North Cariboo Flying Service Ltd. for Worley Parsons' employees commuting to Fort Nelson, British Columbia, for work. ENJ401 made stops in Edmonton, Alberta, and Fort St. John, British Columbia, to pick up passengers. A total of 112 passengers and 6 crew members were on board ENJ401 when it departed Fort St. John for Fort Nelson at 1042.Footnote 1
While in cruise at FL260,Footnote 2 approximately 25 minutes before landing, the captain, who was the pilot flying, briefed the first officer for the approach, informing him that a visual approach to Runway 03, backed up by the instrument landing system (ILS), would be completed with a flap setting of 40 and an autobrake setting of 3. The missed approach would be as published, namely climbing to 4000 feet above sea level (asl) (Appendix A). The first officer entered the flap setting into the flight management computer (FMC), verified the landing weight of 55 967 kg in the FMC and retrieved a landing reference speed (VREF) of 128 knots indicated airspeed (KIAS). This speed was consistent with the VREF speed obtained by using a post occurrence calculated landing weight of 55 397 kgFootnote 3 and the Enerjet Flight Operations Manual (FOM) bulletin B11-08, “B737-700 22K Performance”.
Seventeen minutes before touchdown, air traffic control cleared ENJ401 to track inbound to the Fort Nelson very high frequency omnidirectional range (VOR) via the 133° radial and to descend to 12 000 feet asl. Approximately 9 minutes later, ENJ401 requested and was cleared for a visual approach onto Runway 03 in Fort Nelson. At this time the captain requested that the first officer enter the initial approach fix, BOXEX, into the FMC and proceeded to navigate to that fix. In addition, the captain entered field elevation, 1300 feet asl, into the autopilot flight director system (AFDS) mode control panel (MCP) ALTITUDE window. (Photo 1).

Although Enerjet standard operating procedures (SOPs) allowed for this, it was not a usual practice for the captain to enter field elevation; rather, he would enter field elevation plus 1000 feet.
Six minutes before touchdown, ENJ401 was in the clean configuration (flaps up and landing gear up) descending through 4900 feet asl, 3650 feet above ground level (agl) and decelerating from 245 KIAS. The lateral mode of the auto pilot was engaged in heading select (HDG SEL), the vertical mode in mode control panel speed (MCP SPD), with a selected speed of 240 knots; the autothrottle system (A/T) was armed. In MCP SPD, the aircaft's speed is adjusted by rotating the SPEED knob on the MCP. At this point, 240 knots was selected to respect the aircraft speed limitation regulation of no greater than 250 knots indicated airspeed below 10 000 feet.Footnote 4
Five minutes before touchdown, the Fort Nelson Flight Service Specialist advised ENJ401 that the winds were 240° magnetic (M) at 5 knots and gave the following runway surface condition (RSC) report and Canadian Runway Friction Index (CRFI) for Runway 03:
120 feet centre line, 60% bare and dry, 30% ice patches and 10% frost, remaining width 100% frost. CRFI at −9°C was 0.43; both observations taken at 1030.
Shortly after this information was obtained, the approach was armed (VOR/LOC and GS). Four and a half minutes before touchdown, flap 1 was selected as the aircraft decelerated through 220 KIAS with a MCP selected airspeed of 200 knots in order to comply with the aircraft speed limitation regulation of no more than 200 knots indicated airspeed while below 3000 feet above ground within 10 nm of an airport.Footnote 5 ENJ401 commenced a turn that would intercept the final approach course approximately 1 nautical mile (nm) outside the final approach fix, which is 5 nm from the threshold. At this point the aircraft was descending through 3100 feet asl (1850 feet agl). The Enerjet FOM, which contain the SOPs, recommends 8 to 10 nm final approaches.
Enerjet Flight Operations Manual - Stabilized Approach Criteria
During the final approach and landing phase, it is essential that the activities of the Pilot Flying be closely monitored. The approach shall be stabilized no later than 1000 feet above field elevation. Boeing defines a stabilized approach as follows:
- Aircraft in the final landing configuration
- Power setting appropriate for aircraft configuration
- Airspeed no greater than target +20 knots and trending towards target
- On glide path or assumed 3° glide path
Note: Descent rates above 1000 fpm should be avoided.
The main landing gear will cross the threshold at approximately thirty-five (35) to fifty (50) feet AFE with touchdown at the 1000 foot marker. Avoid any tendency to “duck under” the profile approaching the threshold. If the approach is not stabilized at 1000 feet above field elevation or becomes unstable below 1000 feet, a go-around must be executed.
Three minutes prior to touchdown, and approximately 6 nm from the threshold of Runway 03, ENJ401 was descending through 3000 feet asl (1750 feet agl), and was flying a final approach course intercept heading of 015°M at a speed of 174 KIAS. Flaps were set at 5 and the landing gear was extending, followed shortly after with a selection of flap 15. A speed of 157 KIAS had been selected in the speed window of the MCP. The captain's primary flight display (PFD) showed the localizer pointer moving in from the left and a full upper-limit deflection of the glideslope pointer. The AFDS had captured the localizer.
ENJ401 turned onto the final approach approximately 5 nm from the threshold at 2200 feet asl (950 feet agl) and the captain asked for the landing checklist to be completed. The flaps were at 15 and the landing gear was down. The autopilot was on, the AFDS had captured the localizer, and the glideslope was armed. The captain had selected vertical speed (V/S) on the MCP and entered a descent of -500 feet per minute. The glideslope pointer still showed a full upper limit indication. At this time the enhanced ground proximity warning system (EGPWS) issued an aural glideslope warning twice. The captain advised the first officer that he was correcting and then queried the first officer as to his comfort level with this warning. The first officer acknowledged that it would be okay to continue.Footnote 6 The wind vector displayed on the captain's PFD showed a wind direction of 245° true (T)Footnote 7 at 14 knots. At approximately 1 minute and 50 seconds from touchdown, the captain disconnected the autopilot and entered 1900 feet into the ALTITUDE window of the MCP. The flight mode annunciator (FMA) on the captain's PFD indicated that the A/T was in MCP SPD, the lateral mode was in VOR/LOC and the vertical mode was now in altitude aquire (ALT ACQ) with the glideslope (GS) armed. The captain called for flaps 30 and VREF +5, 133 KIAS, was selected in the MCP. The first officer was still attending to the landing checklist and had completed 2 of the 5 items. The first officer responded on behalf of the captain for the landing checklist speed brake call. The captain then requested flap 40; the landing checklist was completed 70 seconds later.
ENJ401 intercepted the glideslope 40 seconds before touchdown at 420 feet agl. At this time the flight directors were cycled off and then on. Turning off the flight directors switches results in the pitch and roll command bars to disappear on the primary flight display and the AFDS modes currently selected to be turned off, in this case, G/S capture and VOR/LOC respectively. Turning the flight director back on results in the pitch bars returning and defaulting to a selected altitude, in this case ALT ACQ and 1900 feet, and the roll bar to the current heading. The AFDS remained in ALT ACQ with no lateral mode and the A/T was in MCP SPD mode. The aircraft was experiencing a tailwind component of 10 knots, which was decreasing. As the descent continued, the aircraft got a dot high on the glideslope. In response, the captain pitched the nose down and the aircraft's speed increased to 142 KIAS; the vertical descent speed increased to 975 feet per minute (Appendix B).
The EGPWS radar altitude countdown sounded “… 50, 40, 30, 20, 10” but the captain did not disarm the A/T at 50 feet agl in accordance with standard operating procedures. The aircraft touched down at 134 KIAS, 1800 feet from the threshold with 4602 feet remaining. When the captain moved his hand to actuate the thrust reversers, the A/T advanced the thrust levers in order to maintain the selected speed of 133 knots. This action prevented the extension of the speed brakes. The captain repositioned his hand on the thrust levers and brought them to flight idle while disconnecting the A/T. Contrary to Enerjet standard operating procedures, the first officer did not call out “no speedbrake”, “no reverse”, or “autobrake disarm” during the initial roll-out.
Boeing 737-700 Autothrottle (A/T) System
The A/T system provides automatic thrust control from the start of takeoff through climb, cruise, descent, approach and go–around or landing. In normal operation, the FMC provides the A/T system with engine N1 limit values. The A/T moves the thrust levers with a separate servo motor on each thrust lever. Following manual positioning, the A/T may reposition the thrust levers to comply with computed thrust requirements except while in the THR HLD and ARM modes.
At the time of touchdown, the A/T system was in MCP SPD mode with the AFDS set up for ALT ACQ. This configuration does not allow the A/T system to enter retard mode during the flare as this setup is used for a go around situation. The A/T system will retard thrust levers to idle in single autopilot mode only if the AFDS is in approach mode and the aircraft descends through 27 feet radar altitude.
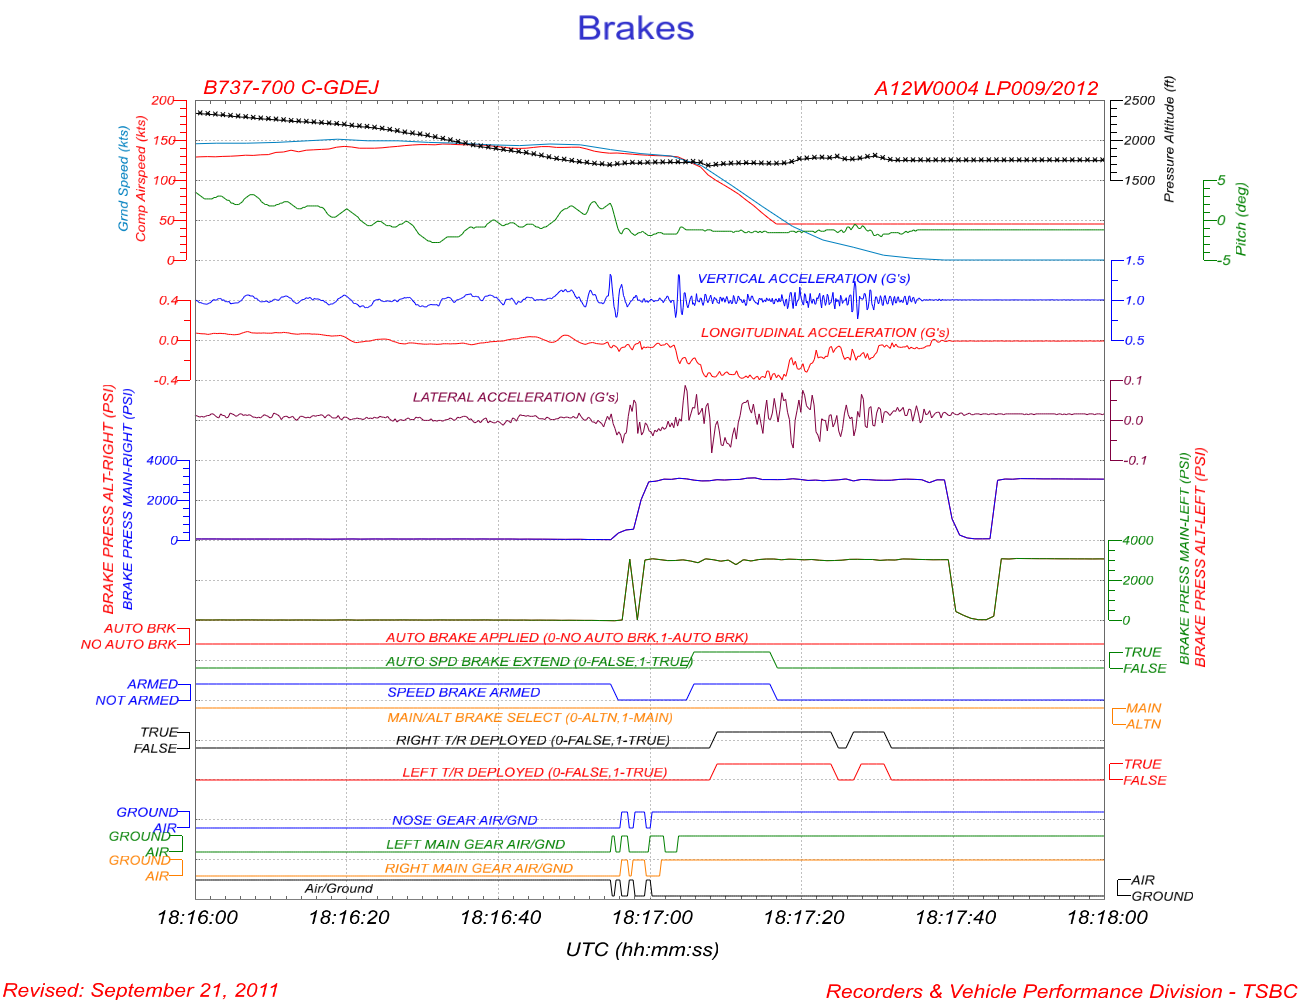
Deceleration began about 5 seconds after touchdown with approximately 2500 feet of runway remaining. At this time full manual braking was being applied with reverse thrust and speed brakes deployed. The longitudinal deceleration force averaged −0.35 g which is consistent with a bare and dry runway (Appendix C). The aircraft exited the end of the runway at approximately 10 to 15 knots and came to a full stop 230 feet from the end and approximately 20 feet left (north) of the extended runway centre line. The main landing gear was on frozen soil and the nose gear was in approximately 18 inches of snow.
The aircraft engines remained running for approximately 70 seconds as the flight crew determined the level of damage and possible injuries. The engines were shut down and the shutdown checklist was completed.
Initially, Fort Nelson Fire Rescue responded with one 1500 gallon water pump truck, a rescue truck, and a pickup truck from town, 9 kilometres from the airport. They were turned back when the flight crew identified that they did not need emergency assistance as there were no indications of fire, damage, or injuries to passengers or crew.
Fort Nelson Airport and rescue and fire-fighting services
The Fort Nelson Airport is certified by Transport Canada and operated by the Northern Rockies Regional District. It has 2 runways, the primary being 03/21. Runway 03/21 is designated a Code 4Footnote 8 runway as per Transport Canada's Aerodromes Standards and Recommended Practices (TP312), and is 6402 feet long, 200 feet wide, and features no slope. The elevation of the runway is 1253 feet asl. A variety of instrument approaches serve the airport including an ILS to Runway 03.
Although no formal runway end safety area was designed into Runway 03 as recommended in Section 3.1.7 of TP312, the terrain up to 150 metres beyond the runway end is free of obstacles and is graded such that rescue vehicles can manoeuver effectively around an aircraft in that area.
Aircraft rescue and fire-fighting (ARFF) services are not available at the airport nor are they required by regulation. CARs 303 stipulates that an airport has to handle more than 180 000 passengers per year to require ARFF. In 2011, Fort Nelson handled 34 206 passengers, and there were 22 050 aircraft movements.
Emergency response for the airport is handled by Fort Nelson Fire and Rescue which is located in the town of Fort Nelson. Response time from the town to the airport is estimated to be 7 minutes. Additional emergency resources may be available from the oil and gas industry located in and around Fort Nelson.
Flight crew
Records indicate that the flight crew was certified and qualified for the flight in accordance with existing regulations.
The captain had approximately 7500 hours total flight time with 2000 hours on type and 50 hours as pilot-in-command. The occurrence flight was the first flight for the captain as a captain with a line first officer. Line indoctrination and flight evaluation reports indicated that his recent upgrade to a captain had gone well and he had been described by his peers and management as a conscientious and knowledgeable pilot. The captain had been off work for 14 days prior to the occurrence.
The captain's residence was not conducive to attaining good quality sleep as the bedroom, located above the boiler room of the apartment complex, was noisy and warm. The captain had had little to no sleep in the 24 hours prior to the flight and considered calling in sick, but due to the time off felt it would not be viewed in a favourable light. There were no indications that the culture at Enerjet was punative towards crew calling in sick for fatigue.
The first officer had approximately 5600 hours total flight time with about 700 hours on type as second-in-command. The first officer had been off for 38 days prior to the occurrence. He had achieved 6.5 hours of sleep prior to checking in at 0600.
The Enerjet Employee Policy Manual states that all employees are responsible for their attendance and punctuality, and for arriving at work fit for duty. This policy is consistent with CARs 602.02 – Fitness of Flight Crew Members. The policy also recognizes that sometimes illness means employees need to stay away from work for a short time in order to recover. The policy is silent on matters specifically related to fatigue.
Fatigue
Fatigue often results from the combination of and the interaction between a person's work schedule and the social and domestic pressures that reduce the opportunity for and quality of sleep.
Shortening a person's total sleep time to less than what they require can result in fatigue.Footnote 9 Sleep must be continuous and without awakenings in order for it to be restorative and reduce the likelihood of fatigue.Footnote 10
The following are common effects of fatigue:Footnote 11
- One of the commonly reported characteristics of performance is a loss in the ability of the worker to perceive and adjust to new aspects of the task. The worker seems unable to shift quickly and effectively from one subpart to another.
- Performance decrements are due to reduced levels of aspiration. The worker is satisfied with a less adequate performance. Small errors go uncorrected, even though they are perceived.
- There is a close correspondence between decrements in performance and the degree of subjective frustration associated with a task.
Mental performance is affected by altered sleep–wake patterns and there are clear links to serious mistakes and accidents.Footnote 12 For example, fatigue and sleep loss have contributed to major operational errors such as altitude deviations, track deviations, landing without clearance, landing on the incorrect runway and improper fuel calculations.Footnote 13 People are poor predictors of their own level of fatigue and the effects that fatigue will have on their performance.Footnote 14
Fatigue risk management systems (FRMS)
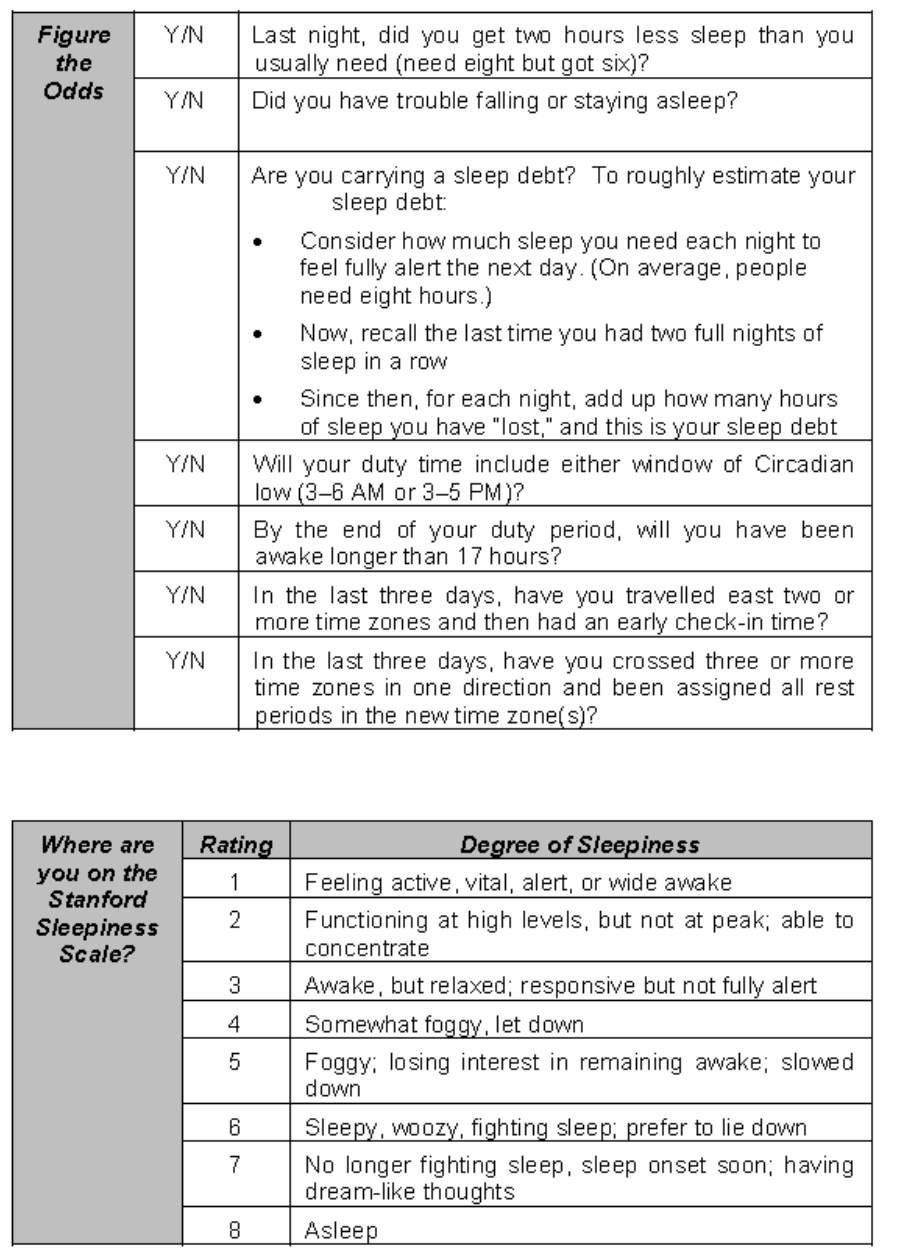
At the time of the occurrence Enerjet did not have an FRMS in place; nor was one required by regulation. Enerjet's safety management system did address the risk of flight crew fatigue which resulted in the request and approval for Transport Canada authority under operations specification 95 to conduct controlled rest on the flight deck. Commercial Air Service Standards (CASS) 720.23, Controlled Rest on the Flight Deck, requires that every crew member who participates to have received training in the program as well as training in the general principles of fatigue and fatigue countermeasures. The Enerjet Company Operations Manual Sections 2.58 and 2.59 contain the information and standard operating procedures related to conducting controlled rest on the flight deck and is the only location in the Company Operations Manual for guidance on assessing flight crew fatigue. In addition, section 2.59 (F) contains an "alertness checklist" which is a tool crew members can use to assess how likely they are to experience fatigue while at work. (Appendix D)
The captain was aware of the checklist but did not use it prior to checking in on the day of the occurrence. The last time Enerjet conducted training with regards to fatigue and fatigue countermeasures was October 2009, which was before the captain was hired.
Predictive tools for scheduling are becoming available for aviation companies to incorporate scientifically based, human fatigue–related information into the decision-making process to improve the identification and managmeent of fatigue risk. The Civial Aviation Safety Authority in Australia reportedFootnote 15 on the effectiveness of these tools. The following is a portion of their summary:
Biomathematical fatigue models have limitations however, which must be appropriately considered. Fatigue model predictions cannot form the sole means upon which fatigue risk management operational decisions are to be made. Limitations of currently used fatigue models include a restriction to predicting risk probabilities for a population average rather than instantaneous fatigue levels of a specific individual, incomplete description of all fatigue physiology factors, qualitative data being misinterpreted as quantitative data and limited validation against aviation specific data… A cautionary approach should be taken and FRMS should be designed as comprehensive, mult-layered systems, in which biomathematical models, if used, provide a supporting role.
The report also commented on future trends with respect to individualized feedback, with data collection providing individually tailored fatigue predictions. Such tools are available now and may improve predictions of fatigue for individuals, but they are only one estimate of the probability of fatigue, not an absolute measure of fatigue risk.
Stabilized approaches
The Flight Safety Foundation Approach and Landing Accident Reduction (ALAR) Task ForceFootnote 16 found that unstabilized approaches (i.e., approaches conducted whether low/slow or high/fast) were a causal factor in 66% or 76 approach-and-landing accident and serious incidents worldwide from 1984 to 1997. The task force identified several factors that contribute to unstabilized approaches:
- Flight crew fatigue
- Failure to recognize deviations or failure to adhere to the excessive-parameter-deviation limits
- Belief that the aircraft will be stabilized at the minimum stabilization height or shortly thereafter
- Excessive confidence by the pilot-not-flying that the pilot flying will achieve a timely stabilization
- Flight crew too reliant on each other to call excessive deviations or to call for a go-around.
Meteorological information
The hourly weather report for Fort Nelson airport taken 17 minutes before the occurrence indicated that the winds were calm, visibility was 30 statute miles, and there were a few clouds at 6000 feet agl, a scattered layer at 14 000 feet agl, and a broken layer at 21 000 feet agl. The temperature was −10 °C and dewpoint −14 °C. The altimeter setting was 29.42 inches of mercury.
The upper-level wind forecast at the time of the occurrence indicated winds at 3000 feet asl to be 290° true (T) at 25 knots and at 6000 feet asl, 280°T at 27 knots with a temperature of −7 °C.
Runway surface condition
The captain obtained an operational flight plan, weather, and notice to airmen (NOTAM) package that was generated at 0411 by a third-party flight planning company. This package contained a runway surface condition report for Fort Nelson that was taken on 8 January 2012 at 1535. It was as follows: 120 feet centre line, 70% frost, 30% ice patches, remaining width 100% dry snow ¼ inch. The Canadian Runway Friction Index (CRFI) at −6 °C was 0.46; both observations taken at 1535.
The captain briefed the first officer on these conditions prior to the day's flying and communicated that there would be sufficient runway at maximum landing weight with a CRFI of 0.46. The flight crew did not obtain an updated runway surface condition report or CRFI report at any time prior to the approach into Fort Nelson.
The following CRFI reports were generated by the Fort Nelson Airport on 09 January 2012:
| Time | Canadian Runway Friction Index |
|---|---|
| 0756 | 0.21 (runway was swept to remove frost) |
| 0841 | 0.42 |
| 0913 | 0.42 (runway surface condition report given to flight service specialist verbally) |
| 1030 | 0.43 (runway surface condition report given to flight service specialist verbally) |
| 1130 | 0.45 (taken 10 minutes after ENJ401 departed runway; lowest of the 12 readings was 0.33) |
The method of obtaining runways surface condition reports and CRFI reports was in compliance with existing standards and practices. The last annual inspection for the decelerometer used for CRFI measurement at the Fort Nelson Airport was on 22 May 2011. The TSB Laboratory examination of the flight data recorder longitudinal deceleration on roll-out was consistent with good braking action. The investigation determined that the deceleration forces were equivalent to that of a bare and dry runway.
Landing Performance
Enerjet FOM bulletin B11-08 “B737-700 22K Performance”, page 24, has a CRFI and equivalent table to determine braking action level as compared with CRFI. With CRFI between 0.27 and 0.49, the equivalent baking action level would be medium. The CRFI was 0.45 when taken 10 minutes after the occurrence.
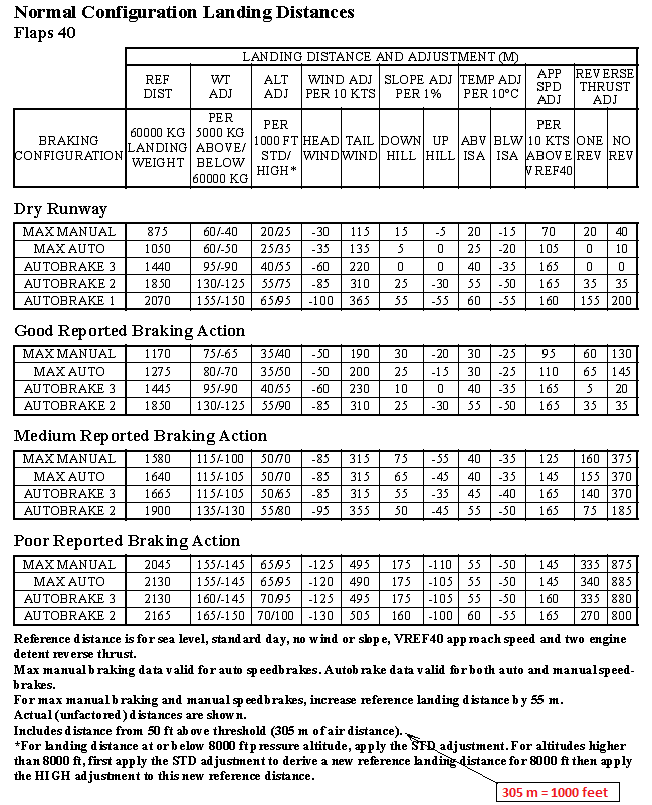
Before departing Calgary, the captain calculated an actual landing distance based on the medium braking action level and a landing weight of 60 000 kg with flap 40, autobrake 3 and in zero wind. That distance was 5463 feet (1665 m) (Appendix E). This distance assumes a threshold crossing height of 50 feet and touchdown within 1000 feet (305 m)Footnote 17 from the threshold. The operational flight plan's factored landing distanceFootnote 18 for the above configuration indicated a distance of 5744 feet for a wet runway.
Using the conditions and aircraft configuration at the time of the occurrence, the actual landing distance required was 6368 feet (1941m)Footnote 19 according to the Boeing Landing Distance Chart. The difference between the pre-departure landing distance and the actual-conditions landing distance is attributed to the higher landing speed and no credit for reverse thrust. The aircraft touched down at 1800 feet from the threshold rather than at the 1000 feet prescribed in the chart, and under these circumstances, the aircraft should have used 7168 feet from the threshold to come to a stop. As it was, the aircraft came to a stop 6632 feet from the threshold.
An alternative method of determining landing distance is to use the dry-runway distance from the Boeing manual, which provides actual distances, and then use Table 1 - Canada Flight Supplement CRFI Recommended Landing Distances (no reverse thrust). The calculation results in a dry-runway landing distance of 3035 feet, which at a CRFI of 0.45 would result in a distance of 5650 feet. Adding the extra 800 feet of runway used in the flare, the distance required would be 6450 feet.
Runway Overruns – Boeing Study
To ensure a stabilized approach and to meet landing performance chart distances, the Boeing Flight Crew Training Manual recommends VREF +5 for non-gusting wind conditions and a touchdown within a distance of 1000 to 2000 feet past the threshold.
Boeing studied 29 minor runway overruns between 2003 and mid-2011 to identify contributing factors (Boeing defines a minor overrun as one that results in no injury or damage).Footnote 20 From that study they discerned four variables:
- Approach and flare
- Speed
- Stopping devices
- Runway conditions/runway length
The study concluded that if one of these variables had been changed/eliminated, then the overrun would not have happened.
Eight of the 29 approaches in the study were unstable, and the study found that flight crew discipline in conducting a go-around is paramount when an unstable approach is identified. A significant challenge is overcoming the flight crew's mindset that they are committed to land and that they can save the landing.
The study further identified that the delayed use of reverse thrust and speed brakes contributed to increased landing distances. Of the 29 cases, 10 had delayed reverse thrust or unarmed speed brakes.
Boeing recommends the following use of reverse thrust:
After touchdown, with the thrust levers at idle, rapidly raise the reverse thrust levers up and aft to the interlock position, then to the reverse thrust position. Maintain reverse thrust as required, up to maximum, until the airspeed approaches 60 knots. At this point start reducing the reverse thrust so that the reverse thrust levers are moving down at a rate commensurate with the deceleration rate of the airplane. The thrust levers should be positioned to reverse idle by taxi speed, then to the stowed position after the engines have decelerated to idle.
The late application of reverse thrust results in the engines spinning down to ground idle. Once they have achieved ground idle, there is a significant increase in the time required to achieve effective reverse thrust. This can be an additional 8-12 seconds.
Boeing identified the following with respect to speed brake:
The lack of speed brake is most significant at high speed. … the deceleration available at 120 knots with no reverse thrust and no speed brakes deployedFootnote 21 reduces the deceleration by 60 to 70% with the expected results on the field length.
In summary, Boeing emphasized:
Over the years, flight crew performance training has been reduced with time pressures and cost pressures. In many places performance training is concentrated on how to obtain the numbers but not necessarily on what the numbers mean and how the airplane has to be flown to achieve the published performance. Finally, it is okay to go around!
TSB Watchlist – Runway overruns
In March 2010, and again in June 2012, the TSB released its Watchlist which included the issue of landing accidents and runway overruns. The TSB has investigated a number of landing accidents and incidents and has identified deficiencies, made findings, and issued safety communications such as runway surface condition reporting requirements and recommendations on runway-end safety areas (RESAs).
In the past 10 years, the TSB has issued 1 recommendation and 4 safety communications on this issue, but more must be done to ensure safe landings.Footnote 22 This occurrence brings attention to the necessity for airports to provide adequate safety areas at the end of runways or other engineered systems and structures to safely stop planes that overrun.
The following TSB Laboratory report was completed:
- LP009/2012 Flight Data Recorder Analysis and Animation
Analysis
Records indicate that the aircraft was certified, equipped, and maintained in accordance with existing regulations and approved procedures, and that the flight crew was certified and qualified for the flight in accordance with existing regulations.
The analysis will revolve around the variables that are common in most runway overruns: those being approach stability, stopping devices, runway surface condition, and runway length. In addition, the analysis will discuss what role fatigue played as a contributing factor.
Approach stability and runway overrun
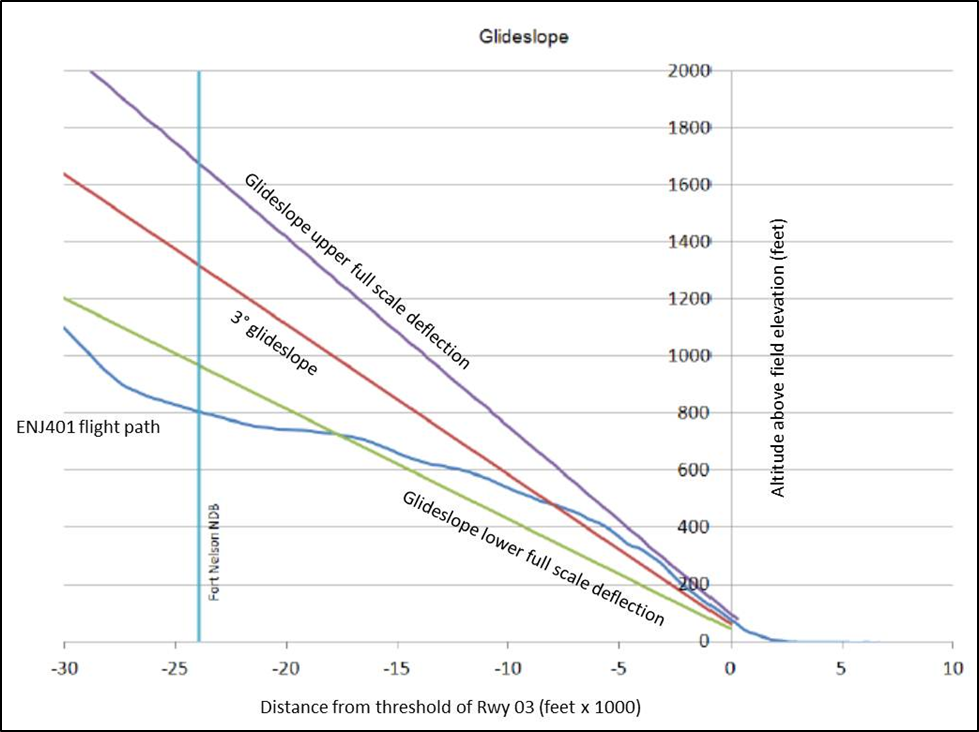
According to the Enerjet definition of a stabilized approach, ENJ401 was not stabilized during the final approach as it did not achieve a 3° glideslope. The flight crew acknowledged this condition after the enhanced ground proximity warning system (EGPWS) provided 2 aural glideslope warnings. The crew elected to continue as the aircraft's speed was stable, the vertical path was trending towards the glideslope, and flap settings were moving towards the landing configuration.The approach appeared to the crew to be salvageable.
On short final and into the flare, the aircraft was flown at 140 KIAS, or VREF +12. The extra speed carried over the threshold resulted in a longer flare and touchdown 800 feet beyond the 1000-feetFootnote 23 touchdown point recommended in the Boeing landing distance chart.
With the A/T system on and in MCP SPD mode, the thrust increased shortly after touchdown in order to maintain the selected speed of 133 knots. With the thrust levers ahead of the idle position, the speed brakes did not deploy; as a result, because the full weight of the aircraft was not on the landing gear, there was less drag and little braking effect from the wheel brakes. In addition, the delay in getting the thrust levers to idle contributed to the late deployment of the thrust reversers. With 2 of 3 stopping devices not being utilized in an optimum way, extra runway was used before any significant deceleration was realized.
The length of the runway was appropriate to the operation but afforded little room for deviation from aircraft speed on landing and the touchdown point. The runway surface condition was as issued and may have even been better in terms of braking friction given the deceleration forces that were realized in the last 2500 feet of the landing roll, and accounts for the aircraft stopping in 6632 feet rather than the 7168 feet predicted by the landing distance chart.
Fatigue
The captain was fatigued, a condition that may have adversely affected his judgement and ability to adequately evaluate and manage operational risks.
Enerjet 401 arrived at 1000 feet above aerodrome elevation in a non-stable configuration as a result of earlier decisions consistent with a combination of attention decrements associated with the captain not attaining appreciable sleep in the 24 hours preceding the flight. These decisions were:
- the selection of field elevation in the mode control panel, where normally 1000 feet above field elevation was used; and
- crossing the final approach fix with the aircraft configured outside the limits defining a stabilized approach (Enerjet stabilized approach criteria).
The crew decision to continue the approach when the aircraft was not in a stabilized configuration is consistent with fatigue-induced reduction in forward planning and a focus of attention towards salvaging the flight by recapturing the glide slope from below. These events were:
- continuation of the approach below 1000 feet when not on a 3° glideslope (Enerjet stabilized approach criteria);
- the selection of 1900 feet in the MCP rather than the briefed missed-approach altitude;
- disconnecting the autopilot just prior to the automation being able to intercept and fly the glideslope;
- the first officer responding on behalf of the captain with regards to the speed brake call during the landing checklist due to the captain focussing attention on hand flying rather than dividing attention between flying and responding to the first officer on the landing checklist; and
- the A/T system remaining on lower than 50 feet above field elevation.
The captain decided to report to work that morning although he had not achieved any appreciable sleep the night before. Although aware of the alertness assessment tool in the Company Operations Manual, the captain did not use it nor did he receive any training from Enerjet on fatigue and fatigue countermeasures.
Alertness checklist
Self-assessment of fatigue is unreliable and the impacts of fatigue are unlikely to be recognized during operations. Fatigued individuals do not realize that their reaction times may be slower, their attention may be focussed rather than alternating between multiple responsibilities, and their ability to analyze future implications of their decisions may be reduced. Because self-assessment is so difficult, the checklist provided by Enerjet may work at cross-purposes.
Answering yes to any of the questions in the first section, “Figure the Odds”, will provide a relatively objective indication of risk of fatigue.
The second section, “Where are you on the Stanford Sleepiness Scale?”, is subject to context effects. If the context of the assessment is an exciting one such as the first flight as a captain, then the heightened arousal state may have masked the underlying risks associated with fatigue in the short term.
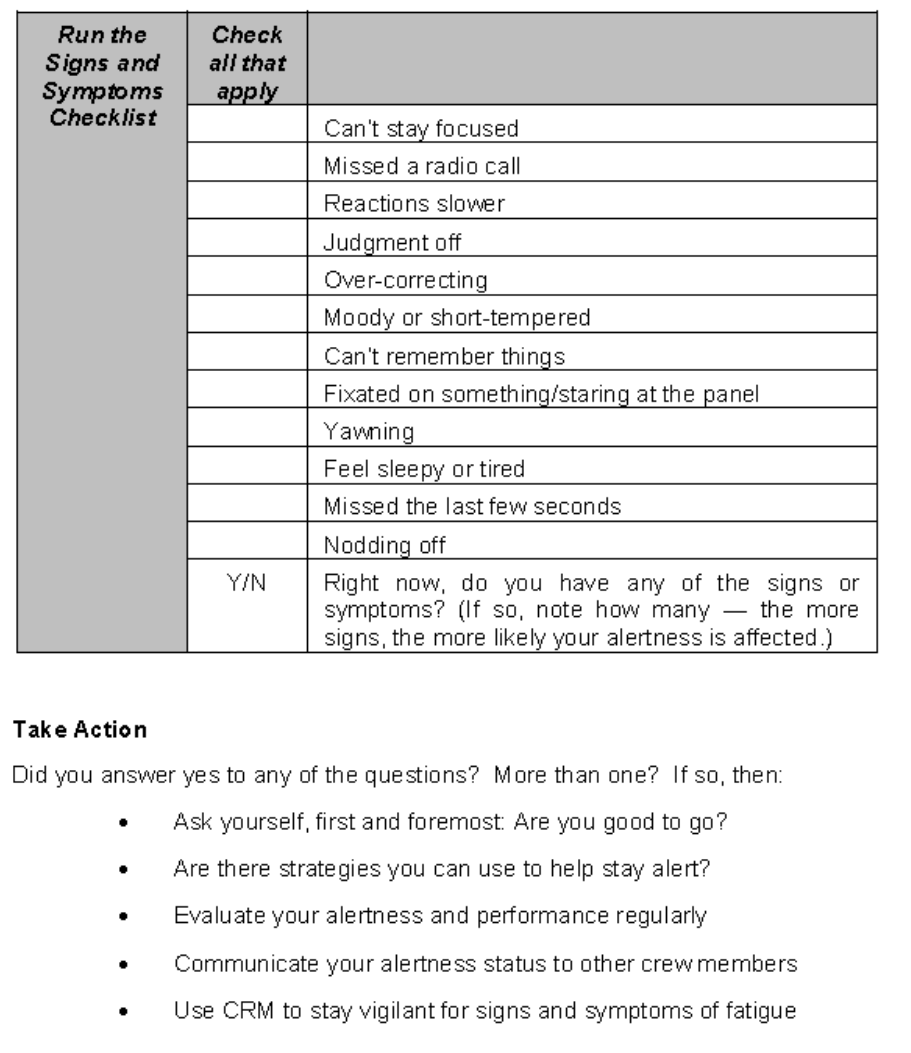
The last section, “Run the Signs and Symptoms”, requires the individual to probe cockpit performance parameters as well as subjective perceptions of sleepiness. These last assessments are post hoc and may be useful indicators for the subsequent flight, but will not have provided any guidance for the flight in which these symptoms occurred.
Finally, the “Take Action” section relies entirely on self-perception of the ability to handle the fatigue identified in the checklists. People are poor predictors of their own level of fatigue and the effects that fatigue will have on their performance. Furthermore, when answering questions such as “Ask yourself, first and foremost: Are you good to go?” and “Are there strategies you can use to stay alert?”, other motivators such as sense of responsibility to the company, or need to be employed are likely to factor into their assessment of fatigue severity. Reliance on pilots monitoring their own level of fatigue may not always identify unacceptable levels of fatigue.
FRMS tools are available to objectively identify fatigue patterns and assess crew alertness prior to operations, but their limitations are such that a multi-layered approach to managing the risks associated with fatigue is required.
Findings
Findings as to causes and contributing factors
- The captain did not attain appreciable sleep in the 24 hours preceding the flight and was fatigued, likely resulting in attention decrements.
- The captain continued the approach when the aircraft was not in a stabilized configuration, consistent with fatigue-induced reduction in forward planning and a focus of attention towards salvaging the flight.
- On short final the captain pitched the aircraft nose down in an attempt to capture the glideslope which was below their flight path. The nose down attitude increased the airspeed resulting in a longer flare and a touchdown beyond the recommended 1000 feet mark, thus reducing the amount of available runway for stopping.
- The autothrottle system was not disengaged below 50 feet, which resulted in the A/T system increasing thrust in order to maintain the selected airspeed. This increase in thrust delayed the deployment of the speed brakes and thrust reversers, which left insufficient runway in which to stop.
Findings as to risk
- If flight crews are not given training on fatigue and fatigue countermeasures, they risk not having the tools they need to deal with fatigue.
- If flight crew are required to assess their own level of fatigue and the effects it will have on their performance, they may not identify unacceptable levels of fatigue.
Other findings
- The conditions experienced on landing were equal to or better than the runway surface condition report and Canadian Runway Friction Index readings indicated.
Safety action
Safety action taken
Enerjet
In May 2012, Enerjet issued a communication to all flight crew that contained an open-book exam on sections 2.58 and 2.59 of the company operations manual. The exams were corrected to 100% at an all-pilots meeting in June 2012. The goals of this activity were to raise awareness of the fatigue self-assessment tool in the company operations manual and to provide an opportunity for reiterating the importance of making fair and honest assessments of fitness for duty and reassuring pilots that booking off duty was non-punitive in cases such as fatigue/illness/stress.
This report concludes the Transportation Safety Board's investigation into this occurrence. Consequently, the Board authorized the release of this report on . It was officially released on .
Appendices
Appendix A – ILS or NDB Rwy 03 Fort Nelson, BC

NOT TO BE USED FOR NAVIGATION PURPOSES
Appendix B – Glideslope deviation
Appendix C – Flight data recorder plot of landing rollout
Appendix D – Enerjet alertness checklist
Appendix E – Landing distance chart (B737-700 22K Performance)